The latest News and Information on Monitoring for Websites, Applications, APIs, Infrastructure, and other technologies.
Any business that considers web traffic to be an important aspect of its acquisition strategy needs to follow SEO best practices. Like it or not, search engines (and one in particular) are the gatekeepers in the digital world and it pays to play by their rules. As such, we thought it might be helpful to put together a quick overview / list of the most important page elements when it comes to SEO.
At Splunk, we've been leading the way in observability and helping accelerate the adoption of the OpenTelemetry project. With the trace specification reaching a stable maturity level and several SignalFx Gateway and client library capabilities being upstreamed, we're ready to go all-in while we continue accelerating the growth and adoption of OpenTelemetry beyond the commitments we made last year.
Every business transformation needs a data strategy and the ability to manage increasingly complex environments. And while companies all over the globe are embracing the cloud, this shift has only exacerbated the associated complexity, compounded by the uncertainty brought about by the current global pandemic. You’ve got more data centers and attack surfaces to monitor and secure, in addition to greater unpredictability and risk.
Logs provide valuable information for troubleshooting application performance issues. But as your application scales and generates more logs, sifting through them becomes more difficult. Your logs may not provide enough context or human-readable data for understanding and resolving an issue, or you may need more information to help you interpret the IDs or error codes that application services log by default.
As the BFSI market gets more crowded, the only real differentiation available for businesses in this industry comes down to superior customer experiences. And this applies to both the internal teams and external customers. If the IT teams at the firm get the right type of support, they can work more efficiently and provide a seamless experience to the external customers.
Surveys show that developers spend roughly 25% of their time troubleshooting issues, amounting to over one working day per week! Let’s examine the solutions that will guide your developers to the log insights they need to efficiently troubleshoot issues.
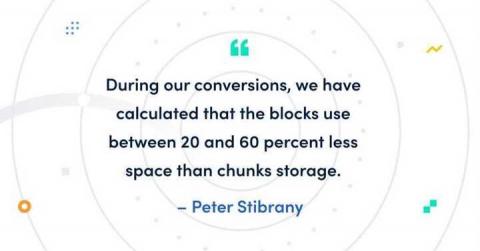
If you’ve been following the blog updates on the development of Cortex – the long-term distributed storage for Prometheus – you surely noticed the recent release of Cortex 1.4, which focuses on making support for “blocks engine” production-ready. Marco Pracucci has already written about the blocks support in Cortex, how it reduces operational complexity for running Prometheus at massive scale, and why Grafana Labs has invested in all of that work.
We software engineers like to think ourselves unflappable. Consider that we spend most of our days staring at glowing pages of eldritch horror that no mortal was meant to witness. We whisper and type our otherworldly incantations, all the while feeling the hungry gaze of a lurking cross-site scripting bug, or a shadowy use-after-free, or an accidental summoning of ZALGO. (H̨e̛ ̕c͢om͢es, you know.)
If our end users end up too long for a query to return results due to Elasticsearch query performance issues, it can often lead to frustration. Slow queries can affect the search performance of an ecommerce site or a Business Intelligence dashboard – either way, this could lead to negative business consequences. So it’s important to know how to monitor the speed of search queries, diagnose and debug to improve search performance.