RMM vs. MDM: Main Differences and Top Tools
Remote monitoring and management (RMM) and mobile device management (MDM) have several key differences—but IT businesses can benefit the most from choosing software that combines both capabilities.


The latest News and Information on Monitoring for Websites, Applications, APIs, Infrastructure, and other technologies.
Graphical processing units, or GPUs, aren’t just for PC gaming. Today, GPUs are used to train neural networks, simulate computational fluid dynamics, mine Bitcoin, and process workloads in data centers. And they are at the heart of most high-performance computing systems, making the monitoring of GPU performance in today's data centers just as important as monitoring CPU performance.
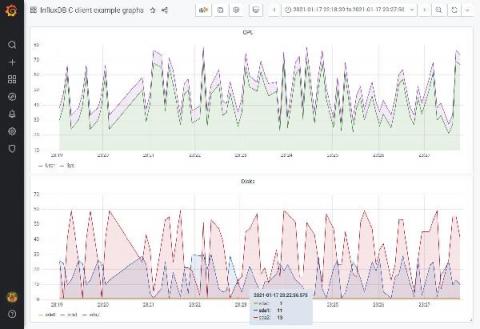
Currently, there is no official InfluxDB C language client library. Fortunately, I wanted to do exactly that for capturing Operating System performance statistics for AIX and Linux. This data capturing tool is called “njmon” and is open source on Sourceforge. So having worked out how and developing a small library of 12 functions for my use to make saving data simple, I thought I would share it. I hope it will prove useful for others.
Network administrators are responsible for the day-to-day operation of computer networks at organizations of any size and scale. Their primary duty is to manage, monitor, and keep a close watch on the network infrastructure to prevent and minimize downtime. Managing a network includes monitoring all the network components, including Windows devices. In any Windows network, the desktops, servers, virtual servers, and virtual machines (VMs), like Hyper-V, run on the Windows operating system.
One of the great things about Logz.io Log Management is that it’s based on the most popular open source logging technology out there: the ELK Stack (click here to view our thoughts and plans on the recent Elastic license). This means Logz.io users get to leverage log shipping and collector options within the rich ELK ecosystem. So how do you know which log shipping technology to use?
If you’re a RabbitMQ user, chances are that you’ve seen queues growing beyond their normal size. This causes messages to get consumed long after they have been published. If you’re familiar with Kafka monitoring, you’ll call it consumer lag, but in RabbitMQ-land it’s often called queue length or queue depth.
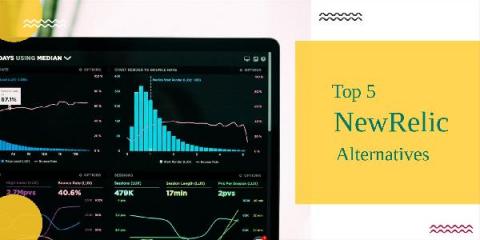
New Relic is one popular for SaaS-based Application Performance Management capable of providing you with a flexible and dynamic approach to monitoring. It is considered to be effective but some may feel it is not cost-effective for small-meidum-size businesses and comes with a very high learning curve. If you want an APM that you can get started quickly, requiring minimal training or experience, New Relic may not be for you.
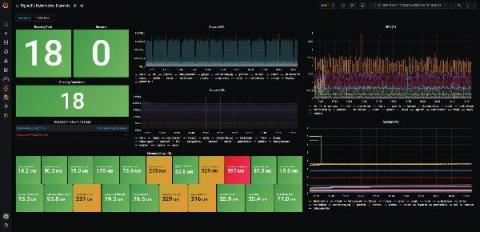
Greetings! This is Mike reporting from the Solutions Engineering team at Grafana Labs. In previous posts, you might have read our beginner’s guide to distributed tracing and how it can help to increase your application’s performance. In this post, we are back to talk about metrics and showcase another one of our newest favorite Enterprise plugins: Splunk Infrastructure Monitoring (formerly known as SignalFx)!