Operations | Monitoring | ITSM | DevOps | Cloud

The latest News and Information on Monitoring for Websites, Applications, APIs, Infrastructure, and other technologies.

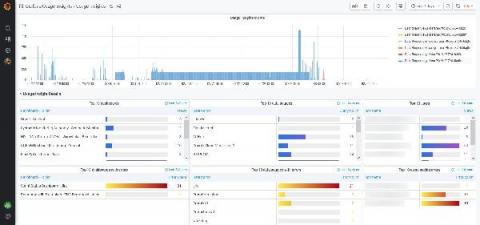
New in Grafana 7.4: Export usage data to Loki to help manage dashboard sprawl and troubleshoot faster

We first released the usage insights Enterprise feature in Grafana 7.0 based on feedback from customers that they would like to better understand how their users are interacting with Grafana, including the dashboards they visit, the information they query, and where they run into issues. What we learned was that dashboard sprawl is a real issue: Administrators estimate that almost 60% of dashboards might not be used at all.
All together now: Bringing your GKE logs to the Cloud Console

Troubleshooting an application running on Google Kubernetes Engine (GKE) often means poking around various tools to find the key bit of information in your logs that leads to the root cause. With Cloud Operations, our integrated management suite, we’re working hard to provide the information that you need right where and when you need it. Today, we’re bringing GKE logs closer to where you are—in the Cloud Console—with a new logs tab in your GKE resource details pages.

Metricbeat Deep Dive: Hands-On Metricbeat Configuration Practice

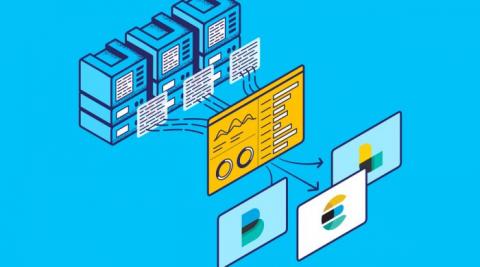
Metricbeat, an Elastic Beat based on the libbeat framework from Elastic, is a lightweight shipper that you can install on your servers to periodically collect metrics from the operating system and from services running on the server. Everything from CPU to memory, Redis to NGINX, etc… Metricbeat takes the metrics and statistics that it collects and ships them to the output that you specify, such as Elasticsearch or Logstash.

Doubling Down: What It's Like Contributing to Open Source at Logz.io

Logz.io has always prided itself as a company pushing the use of open source tech. As we have moved to expand our reach with metrics and traces over the past year and a half, we have doubled down on our own contributions to the community. With (distributed) traces in particular, we have been able to forge ahead. Our relationship with the teams at Jaeger and OpenTelemetry have really blossomed (and we are kind of proud to have supported the latter in the run-up to the OpenTelemetry v1.0 release).

How to Monitor Microsoft SharePoint Online Performance

In this video, we’ll cover the basics of getting started with Exoprise CloudReady and how to set up your first sensor to monitor Microsoft 365 SharePoint from your own locations or behind the firewall. You will learn how to quickly install the management client, add a private site, deploy a SharePoint sensor and visualize the data in the CloudReady platform all in under 5 minutes. CloudReady supports deploying private sensors behind your firewall or public sensors in the cloud for synthetic transaction monitoring. Service watch, on the other hand, can be deployed for real user monitoring of remote user issues.

Most Essential Tools Help Track Website Performance

Websites and web applications are the modern equivalents to storefronts, business cards, road show booths, newspapers, markets, bulletin boards, software installed on the client’s machine, and much more. Being a business-critical component, and sometimes the business itself in the case of SaaS applications, a website or app experiencing any downtime or disruption can have serious financial implications (aka clients and prospects leaving).

5 Reasons You Don't Need a Management Title to Be a Leader

Leaders can be categorized, somewhat, by their motivation. I recall an offsite meeting a few years ago that began with everyone contemplating the question, "Why do you lead?" There were about 15 people in the room, and each attendee could be grouped in one of the following categories: Nothing is wrong with any of these categories necessarily. They’re all concepts that can drive either positive or negative outcomes.

What is Observability

As IT environments become more complex, enterprises running business-critical workloads in dynamic environments need to ensure the performance and reliability of their applications. This is where observability comes in. Observability is the ability of the internal states of a system to be inferred from external outputs. Without it, your team’s productivity could be greatly diminished.