Tutorial: Set Up a Windows JSON Source
Learn how to set up a Windows JSON Source to an installed collector in Sumo Logic.


The latest News and Information on Log Management, Log Analytics and related technologies.
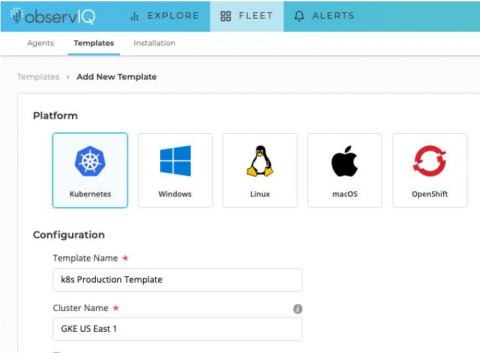
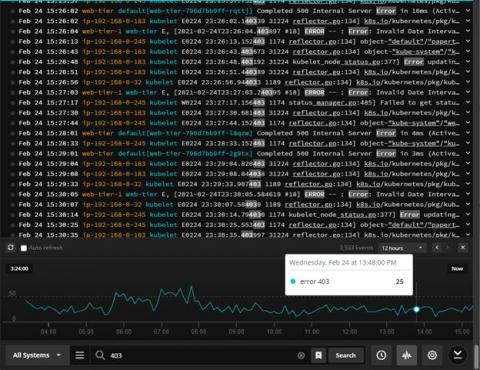
If you’re running a fleet of containerized applications on Kubernetes, aggregating and analyzing your logs can be a bit daunting if you’re not equipped with the proper knowledge and tools. Thankfully, there’s plenty of useful documentation to help you get started; observIQ provides the tools you need to gather and analyze your application logs with ease.
Today, I’m happy to share more about our partnership and commitment to our users that they will have the best possible experience of both Elasticsearch and Grafana, across the full breadth of Elasticsearch functionality, with dedicated engineering from both Grafana Labs and Elastic. Through joint development of the official Grafana Elasticsearch plugin users can combine the benefits of Grafana’s visualization platform with the full capabilities of Elasticsearch.
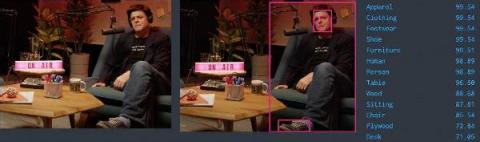
Splunk is a fantastic platform for ingesting, storing, searching and analysing data from logs, metrics and traces from a massive variety of sources. But does that mean we should ignore all of that data that doesn’t fall into these categories, like image and video data for example? Of course not!
I drive a 2005 Ford diesel pickup truck. Most of the time my truck runs great. But occasionally an orange light on the dashboard will flicker on to alert me that something is wrong. Unfortunately, there’s no information about what is wrong and why. My truck has a monitoring solution, but not an observability solution. In many cases, IT has the same problem as my truck.