Machine learning has infiltrated the world of security tooling over the last five years. That’s part of a broader shift in the overall software market, where seemingly every product is claiming to have some level of machine learning. You almost have to if you want your product to be considered a modern software solution. This is particularly true in the security industry, where snake oil salesmen are very pervasive and vendors typically aren’t asked to vigorously defend their claims.

In Part 1 of this series, we talked about the origins of observability and why you need it. In this blog (Part 2), we will cover exactly what observability is, what it isn’t, and how to get started. Before we can dive into how to approach observability, let’s get one thing clear: You can’t buy a one-size-fits-all observability solution.
Redis is an open-sourced, BSD 3 licensed, highly efficient in-memory data store that can be easily used as a distributed, in-memory key-value store, cache, or message broker. It is known for being extremely fast, reliable, and supporting a wide variety of data structures, making it a very versatile tool widely adopted across the industry. Redis was architectured with speed in mind and is designed in a way that it keeps all the data in memory.
We’ve got a lot of OpenTelemetry-flavored honey to send your way, ranging from OpenTelemetry SDK distribution updates to protocol support. We now support OpenTelemetry logs, released a new SDK distribution for OpenTelemetry Go, and have some updates around OpenTelemetry + Honeycomb to share. Let’s see what all the buzz is about this time! 🐝🐝
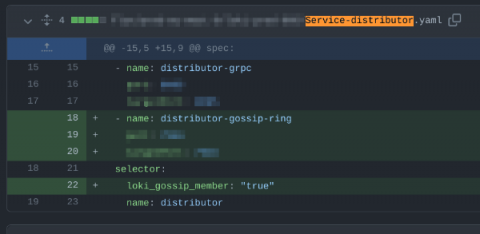
Hello, I’m Callum. I work on Grafana Loki, including the hosted Grafana Cloud Logs offering. Grafana Loki is a distributed multi-tenant system for storing log data — ingestion, querying, all that fun stuff. It also powers Grafana Cloud Logs.
In this post, we’ll discuss two functions in the Cribl Stream arsenal: The Aggregations function, which allows you to perform stats and metrics collection in flight, and the Chain function allows you to call one Pipeline from within another. The event flow will continue when the Chained Pipeline returns. To demonstrate their use, we’ll answer this question: How long did it take for Cribl to process events using your pipeline?
As a principal engineer on the Splunk Real User Monitoring (RUM) team who is responsible for measuring and monitoring our service-level agreements (SLAs) and service-level objectives (SLOs), I depend on observability to measure, visualize and troubleshoot our services. Our key SLA is to guarantee that our services are available and accessible 99.9% of the time.
With its market size reaching more than $2 billion in 2020, you’d think that a universal definition of the term observability would have emerged by now. But it turns out that a clear definition of a term or industry isn’t necessarily a prerequisite for the rapid growth of its market size — just ask everyone at your next dinner party to define blockchain for you and see how many different answers you get!
Microsoft Azure’s recently launched new Azure Virtual Machines (VMs) feature the Ampere Altra Arm-based processor. These new VMs are engineered to efficiently run horizontally scalable workloads such as web servers, application servers, and open source databases. They deliver excellent price-performance and represent an important addition to Microsoft Azure's portfolio of instance types.
You’ve probably heard something like this before: “It’s a managed service! We don’t need to worry about anything!” But when it comes to your production workloads, database monitoring is imperative. With the new Snowflake Dashboards and Detectors in the Splunk Observability Content Contributors repository you can start seeing the details of individual Snowflakes.
As distributed environments become more complex, users often use distributed tracing tools to improve the visibility of issues evident within their traces. Throughout this post, we will examine some of the best open-source and other generally popular distributed tracing tools available today.
The best part of my job is talking with prospects and customers about their logging and data practices while explaining how Cribl focuses on getting more value from observability data. I love to talk about everything they are doing and hope to accomplish so I can get a sense of the end state. That is vital to developing solutions that provide overall value across the enterprise and not just a narrow tactical win with limited impact.
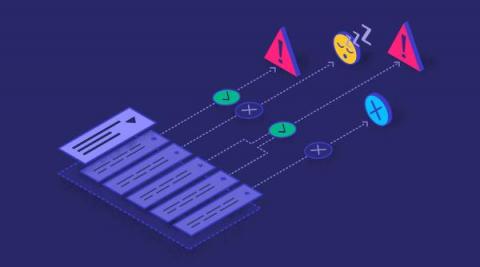
The way organizations process logs have changed over the past decade. From random files, scattered amongst a handful of virtual machines, to JSON documents effortlessly streamed into platforms. Metrics, too, have seen great strides, as providers expose detailed measurements of every aspect of their system. Traces, too, have become increasingly sophisticated and can now highlight even the most precise details about interactions between our services. But alerts have remained stationary.
When we say “logs” we really mean any kind of time-series data: events, social media, you name it. See Jordan Sissel’s definition of time + data. And when we talk about autoscaling, what we really want is a hands-off approach at handling Elasticsearch/OpenSearch clusters. In this post, we’ll show you how to use a Kubernetes Operator to autoscale Elasticsearch clusters, going through the following with just a few commands.
A SIEM (Security Information Event Management) platform, along with several other tools that make you crave Alphabet Soup (XDR, UBA, NDR, etc), is a critical component of any organization’s security infrastructure. Between a constantly growing volume of logs, increasing attacks and breaches, and challenges finding qualified staff, many organizations may consider a SIEM migration. There could be several reasons for this.
OpenTracing was an open-source project developed to provide vendor-neutral APIs and instrumentation for distributed tracing across a variety of environments. As it is often extremely difficult for engineers to see the behaviour of requests when they are working across services in a distributed environment, OpenTracing aimed to provide a solution to heighten observability.
Inc. is shining a light on Mezmo as one of the fastest growing companies in the nation. We are truly honored to be featured alongside innovative brands like Sentry and Calendly, who are building the future of tech. Our position on the list at number 695 reflects our 900% growth in revenue and 300% growth in the size of our team from 2018 to 2021.
InfoSec, like any other aspect of IT, is a matter of three factors coming together: people, process and technology. All of these factors cost time and money in some way. The truth is, there are very few organizations out there who can supply their own security programs, staff, technology, processes and everything needed for InfoSec to an efficient degree. Everyone has to compromise in some way.
If you asked your engineering team how well they can handle all of the security and observability data they’re managing, would you get a resounding “Yeah boss, we’re good to go!” in response? Possible, but unlikely. Chances are they feel like they’re stuck on a boat that’s taking on water, spending their day using tiny buckets to scoop some of it out, with no way to plug any of the leaks.
As companies evolve and grow, so do the number of applications, databases, devices, cloud locations, and users. Often, this comes from teams adding tools instead of replacing them. As security teams solve individual problems, this tool adoption leads to disorganization, digital chaos, data silos, and information overload. Even worse, it means organizations have no way to correlate data confidently. By centralizing log data, you can overcome the data silos that tool proliferation creates.
Alerting has been a fundamental part of operations strategy for the past decade. An entire industry is built around delivering valuable, actionable alerts to engineers and customers as quickly as possible. We will explore what’s missing from your alerts and how Coralogix Flow Alerts solve a fundamental problem in the observability industry.
We’ve reached the point in the DevOps transformation where efficiency and automation are no longer the highest objectives. The next step is engineering past automation and towards fully autonomous, self-healing systems. If you aren’t conversing about building this type of resilience into your systems and applications, there’s never been a better time than now to start.
IT roles have never been more in demand and IT salaries have never been higher, according to recent reports and data sources. Whether you are hiring, looking for a career change, or simply work in tech, it’s important to stay up-to-date on the state of employment in the industry. This blog post will review, roundup, and summarize some of the latest trends for IT salaries and demand by role and location (among other variables) to help you get a clear view of the landscape.
A rising number of businesses are adopting and utilizing cloud services and capabilities with remarkable success. But embracing cloud tools and services often brings unexpected changes for business leaders and IT teams, especially because of the way in which cloud adoption has altered how networks are monitored and managed.
Systems and applications alike have become progressively distributed as microservices, open-source tools, and containerisation have gained traction. In order to actively monitor and respond quickly to issues that arise in our environment, distributed tracing has proven to be vital for businesses such as Uber, Postmates, Hello Fresh and TransferWise. It is, however, important to clarify what distributed tracing actually means.
The cyberthreat landscape has expanded in recent years, accelerated by enterprises promoting remote work and more reliance on cloud computing. These are a business necessity, and yet, facing down cybersecurity threats often doesn’t come with an expansion of resources to address them. In a future post, I’ll discuss more about the Security Poverty Line, and how organizations deal with its harsh trade-offs and compromises in an uncompromising landscape.
It’s time for the Black Hat conference in the United States, so we’re onsite meeting with customers and prospects looking to untangle their data from the grip of vendors holding their data hostage. We aim to start a rebellion against this lock-in and encourage customers to focus on radical choice and control with their observability data. Pushing back against “The Empire” is challenging, but you can achieve it with Cribl Stream and Edge.
Cloud services were born at the beginning of 2000 with companies such as Salesforce and Amazon paving the way. Simple Queuing Service (SQS) was the first service to be launched by Amazon Web Services in November 2004. It was offered as a distributed queuing service and it is still one of the most popular services in AWS. By 2006 more and more services were added to the offering list.
How do you pass context from events that concern Security teams to Development teams who can make changes and address those events? Often this involves a series of meetings and discussion that can take days or weeks to filter down from security event to developer awareness. Compounding the problem, developers generally do not have access to Splunk Core, Cloud or Enterprise indexes used by security teams, and indeed, may use only Splunk Observability for their metrics, traces and even logs.
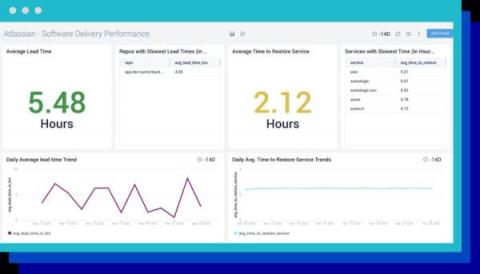
Everyone in the software industry is in a race to become more agile. We all want to improve the performance of our software development lifecycle (SLDC). But how do you actually do that? If you want to improve your performance, first determine what KPI you’d like to improve. DORA metrics offer a good set of KPIs to track and improve. It started as a research by the DevOps Research and Assessment (DORA) and Google Cloud (which later acquired DORA), to understand what makes high performing teams.
When I had my first child almost six years ago, I expected that most of my time would be spent in the role of a teacher rather than a student. I have two kids now — and I’m certainly teaching them as much as I can as they grow and learn to navigate the world — but if someone were keeping score, my kids might end up on top when it comes to who’s taught who more. Another thing that surprised me is how similar building a family is to build a company from the ground up.
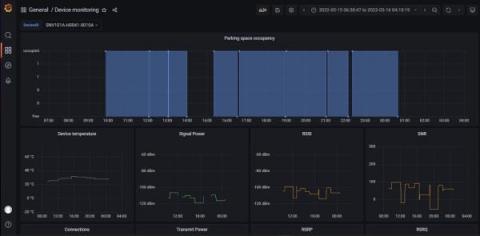
For smart cities of the future, monitoring infrastructure metrics like fuel and water levels is vital to optimizing operations. Fuelics PC designs and deploys battery-operated narrowband IoT (NB-IoT) sensors that monitor fuel, water, waste, and even parking capacity at the edge, then transmit that data to the cloud for easy viewing and monitoring.
If you were pulled into a meeting right now and asked to give your thoughts on how to achieve better outcomes with monitoring and observability, what would you recommend? Would you default to suggesting that your team improve Mean Time To Detect (MTTD)? Sure, you might make some improvements in that area, but it turns out that most of the opportunities lie in what comes after your system detects an issue. Let’s examine how to measure improvements in monitoring and observability.
The best part of my job is talking with prospects and customers about their logging and data practices. I love to talk about everything they are currently doing and hope to accomplish so I can get a sense of overall goals and understand current pain points. It’s vital to come up with solutions that provide broad value across the enterprise and not just a narrow tactical win with limited impact.
Organizations in every industry are becoming increasingly dependent upon data to drive more efficient business processes and a better user experience. As the data collection and preparation processes that support these initiatives grow more complex, the likelihood of failures, performance bottlenecks, and quality issues within data workflows also increases.
When new web browser versions are released, new bugs are inevitably introduced, which can degrade a website’s performance and increase the overall page load time. This can severely impact a user’s engagement and a business’s bottom line.
Developing a strategy for collecting application-level logs necessitates stepping back and looking at the big picture. Engineers developing the applications may only see logging at its ground level: the code that writes the event to the log—for example a function that captures Warning: An interesting event has occurred! But where does that message go from there? What path does it travel to get to its destination?
Splunk is honored to be the recipient of a series of six new awards from TrustRadius—all based on customer reviews. In this round, TrustRadius grants its “Best of” Awards to the top three products per Best Feature Set, Best Value for Price and Best Relationship in each respective category.
The Splunk Operator for Kubernetes team is extremely pleased to announce the release of version 2.0! This represents the culmination of many months of work by our team and continues to deliver on our commitment to provide a high-quality experience for our customers wishing to deploy Splunk on the Kubernetes platform.
Observable and secure platforms use three connected data sets: logs, metrics, and traces. Platforms can link these data to alerting systems to notify system administrators when an event requires intervention. There are nuances to setting up these alerts so the system is kept healthy and the system administrators are not chasing false positive alerts.
How much does monitoring and observability actually cost us? We all collect logs, metrics, traces, and possibly other telemetry data. Yet, this can get expensive pretty quickly, especially in today’s microservices-based systems.
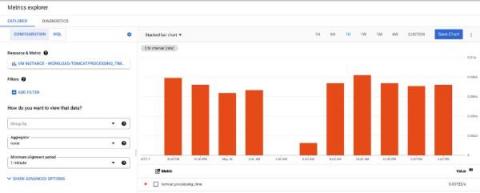
The Apache Tomcat is an open-source implementation of the Jakarta Servlet, Jakarta Server Pages, Jakarta Expression Language, Jakarta WebSocket, Jakarta Annotations and Jakarta Authentication specifications, all being a part of the Jakarta EE Platform. That is the official description of Apache Tomcat.
Organizations leverage many different cybersecurity and observability tools for different departments. It’s common to see the IT department using Splunk Enterprise, while the SOC uses Exabeam. Both of these tools use separate agents, each feeding different data to their destinations. Normally this isn’t a problem unless you’re talking about domain controllers. Domain controllers only allow a single agent, meaning you can’t feed two platforms with data.
One year ago, we launched Cribl.Cloud as a cloud-hosted option for our industry-leading data pipeline product, Cribl Stream. Customers had a choice of either deploying on-premises with a subscription-based tiered license model or opting for our cloud service with a similar tiered billing model. Fast-forward one year, and Cribl is now a multi-product company with several unique observability products (Stream, Edge, AppScope, and soon Search) to offer our customers.
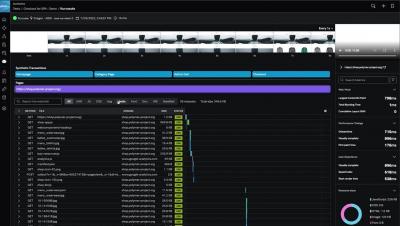
Today we’re proud to announce the general availability of best-in-class Synthetic Monitoring capabilities within Splunk Observability Cloud. Now, IT and engineering teams can proactively measure, monitor and troubleshoot their critical user flows, APIs and services, connected across Splunk Observability.
They say, “What happens in Vegas, stays in Vegas,” but I wanted to highlight the role our customers played at last month’s.conf22, our annual users’ event at the MGM Grand. It was awesome meeting customers in person again, and connecting virtually with thousands more. We had a terrific turnout with 8,200+ customers and partners representing 113 countries and more than 6,500 organizations.