Operations | Monitoring | ITSM | DevOps | Cloud

The latest News and Information on Log Management, Log Analytics and related technologies.

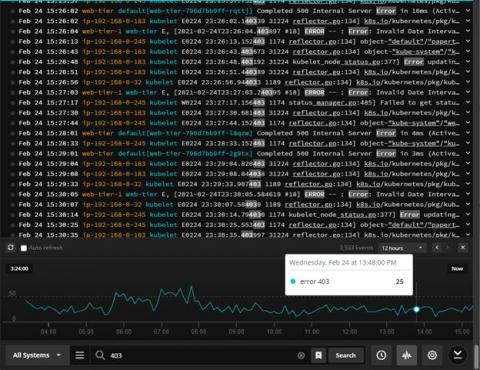
Debugging Development Logs with Papertrail and rKubeLog

It’s important to ensure the logging and monitoring of a service is as consistent across environments as the code itself. However, it can be expensive and cumbersome to test the logging functionality with the usual required log exporters, database infrastructure, and processing requirements of normal production-grade solutions.

SQL Sentry Events Log Updates Provide a Centralized View of Events

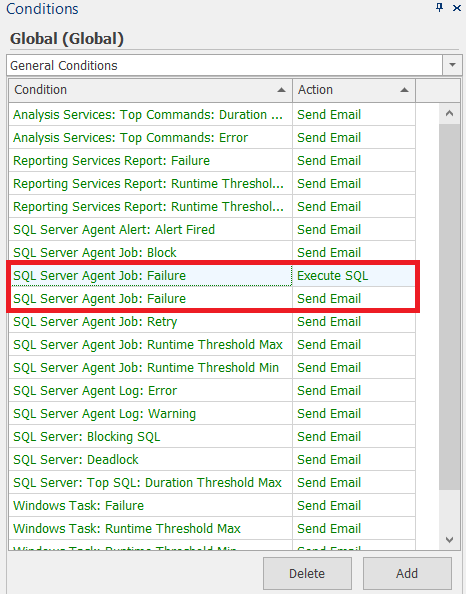
The SQL Sentry Environment Health Overview (EHO), which is part of the dashboard shown on the Start page, enables you to see all the conditions that have fired alongside the overall health of your database environment. We understand how useful it is to be able to quickly review the health information without having to dig deep into performance data, and we’re excited to announce a few enhancements to the EHO, Events Log, and Actions Log available in the SQL Sentry 2021.1 release.

Elastic + Grafana Labs partner on the official Grafana Elasticsearch plugin

Today, I’m happy to share more about our partnership and commitment to our users that they will have the best possible experience of both Elasticsearch and Grafana, across the full breadth of Elasticsearch functionality, with dedicated engineering from both Grafana Labs and Elastic. Through joint development of the official Grafana Elasticsearch plugin users can combine the benefits of Grafana’s visualization platform with the full capabilities of Elasticsearch.

Security operations center, Part 3: Finding your weakest link

Any organization with data assets is a possible target for an attacker. Hackers use various forms of advanced cyberattack techniques to obtain valuable company data; in fact, a study by the University of Maryland showed that a cyberattack takes place every 39 seconds, or 2,244 times a day on average. This number has increased exponentially since the COVID-19 pandemic forced most employees to work remotely, and drastically increased the attack surface of organizations around the world.

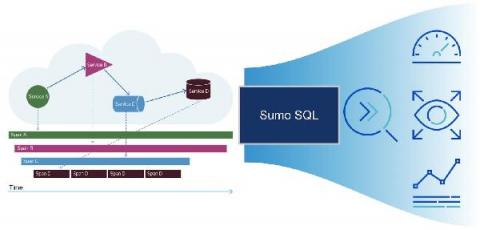
Analyze your tracing data any way you want with Sumo search query language

It’s been almost a year since I shared some thoughts about distributed tracing adoption strategies on this blog. We have discussed how different approaches between log vendors and application performance management (APM) vendors exist in the market and how important that is to allow users to analyze the data, including custom telemetry, the way they want.

The Cost of Racing Toward Success

LogDNA recently celebrated 5 years since our launch in Y Combinator and during this half-a-decade we’ve learned several lessons about balancing cost and scalability. As a founder, here are the top 3 things I wish someone had told me as we were racing towards success. The appeal of building a cloud-native application for a startup is a no brainer—it’s agile, scalable, and can be managed by a distributed team. Not to mention, it’s the cheapest way to get off the ground.

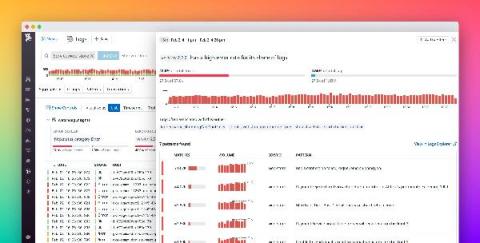
Accelerate your logs investigations with Watchdog Insights

If you’re investigating an incident, every minute means degraded performance or even downtime for customers. The causes of an issue often come from parts of your systems and applications that you would not think to check, and the sooner you can bring these to light, the better.

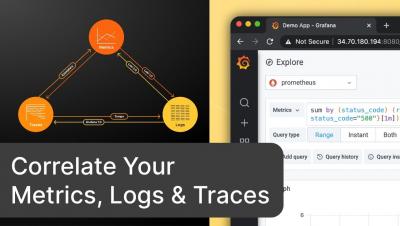
Correlate Your Metrics, Logs & Traces with the curated OSS observability stack from Grafana Labs

Correlation between metrics, logs, and traces should be as effortless as possible. This helps you make better decisions and actions. The Grafana Labs open-source observability stack enables powerful correlations between your metrics, log, and traces. The key here is to have consistent metadata across the three pillars of observability. Let me demo you how this works in this video.

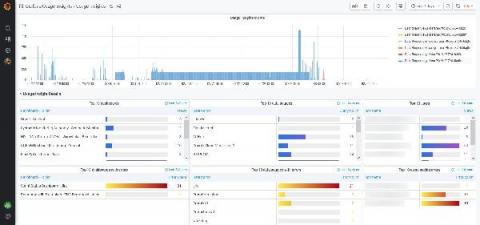
New in Grafana 7.4: Export usage data to Loki to help manage dashboard sprawl and troubleshoot faster

We first released the usage insights Enterprise feature in Grafana 7.0 based on feedback from customers that they would like to better understand how their users are interacting with Grafana, including the dashboards they visit, the information they query, and where they run into issues. What we learned was that dashboard sprawl is a real issue: Administrators estimate that almost 60% of dashboards might not be used at all.

All together now: Bringing your GKE logs to the Cloud Console

Troubleshooting an application running on Google Kubernetes Engine (GKE) often means poking around various tools to find the key bit of information in your logs that leads to the root cause. With Cloud Operations, our integrated management suite, we’re working hard to provide the information that you need right where and when you need it. Today, we’re bringing GKE logs closer to where you are—in the Cloud Console—with a new logs tab in your GKE resource details pages.