This is a short blog post about a pattern that we’ve observed more frequently among some of the large enterprises: the use of AWS S3 as both an observability lake and a data bus. AWS S3’s simple API, ubiquitous language support, unmatched reliability and durability, retention options, and numerous pricing plans have made it the de facto standard for storing massive amounts of data.
In this post, we’ll walk through our journey of launching Cribl LogStream Cloud on AWS Graviton instances. In order to put our journey into perspective, it is worth spending a few moments to describe the product and its resource requirements.
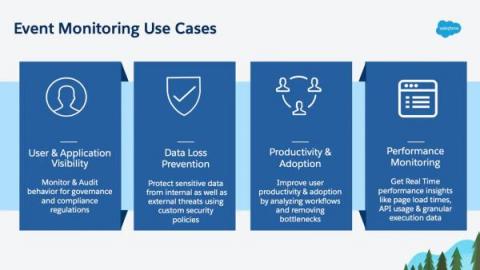
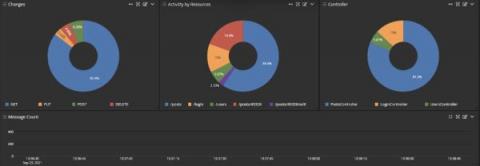
In 2019 Salesforce announced the general availability of Real-Time Event Monitoring (RTEM) which includes 19 different events that help monitor & secure your Salesforce data. Real-Time Event Monitoring stores events for 6 months as Salesforce Big Objects and streams events via Salesforce’s Streaming API in near real-time.
In this episode of the Stream Life Podcast, Nick Heudecker and Ed Bailey look at SaaS security platforms and managed security providers and how they’ve grown over time. They look at the benefits the model brings to organizations, how it is growing across the world, the challenges it can also bring, and the questions you should be asking your vendors.
Logz.io has dedicated itself to encouraging and supporting cloud-native development. That has meant doubling down on support for AWS and Azure, but also increasing our tie-ins with Google Cloud Platform – GCP. Recently, our team added dozens of new integrations for metrics covering the gamut of products in the GCP ecosystem.
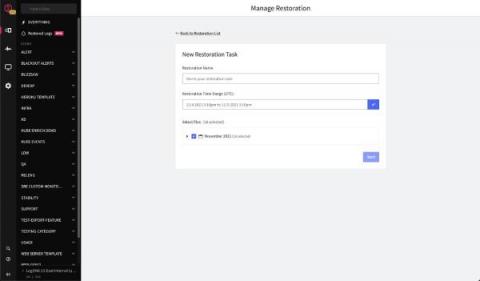
Like many cool tools out there, this project started from a request made by a customer of ours. Having recently migrated to our service, this customer had ~30TB of historical logging data. This is a considerable amount of operational data to leave behind when moving from one SaaS platform to another. Unfortunately, most observability solutions are built around the working assumption that data flows are future-facing.
Kubernetes management can be daunting for developers who don’t have specialized understanding of the orchestration technology. Learning Kubernetes takes practice and time, a precious commodity for devs who are under pressure to deliver new applications. This post provides direction on what you need to know and what you can skip to take advantage of Kubernetes. Let’s start with five things you need to know.
In the tech industry, we obsess over the latest and greatest. When it comes to observability, we’re always looking at the most advanced hardware, the enthusiasts’ favorite systems, and the tech venture capital trends to get an idea of what to build for next. observIQ is no exception.
At Coralogix, we believe in giving companies the best of the best – that’s what we strive for with everything we do. With that, we are happy to share that Coralogix has received AWS DevOps Competency! Coralogix started working with AWS in 2017, and our partnership has grown immensely in the years since. So, what is our new AWS DevOps Competency status, and what does it mean for you?
Cribl released LogStream Cloud to the world in the Spring of 2021, making it easier than ever to stand up a functional o11y pipeline. The service is free for up to 1TB per day and can be upgraded to unlock all the features and support with paid plans starting at $0.17 per GB so you pay for only exactly what you use. In this blog post, we’ll go over how to quickly get data flowing into LogStream Cloud from a few common log sources.
For years customers have leveraged the power of Splunk configuration files to customize their environments with flexibility and precision. And for years, we’ve enabled admins to customize things like system settings, deployment configurations, knowledge objects and saved searches to their hearts’ content. Unfortunately a side effect of this was that multiple team members could change underlying.conf files and forget that those changes ever occurred.
Sean Tierney is the DevOps lead at Athos, a company that's building better athletes through smart clothing and AI. Sean reinforces a DevOps state of mind across the organization by building empathy between hardware and software teams and putting the systems in place to allow them to move faster as a single unit.
One of the nicest things about Byte Buddy is that it allows you to write a Java agent without manually having to deal with byte code. To instrument a method, agent authors can simply write the code they want to inject in pure Java. This makes writing Java agents much more accessible and avoids complicated on-boarding requirements.
Apache – the technology that powers the web. I’m not sure if that is correct, but I think that we wouldn’t see the world wide web in its current shape without it. Launched in 1995 and since April 1996, it has been the most popular web server around the world. Because of handling your users’ requests, Apache serves as the front application. It is crucial to understand what your server is doing, what file users are accessing, from where they came, and much, much more.
IT experts agree that log management and monitoring is one of the most effective ways to keep IT infrastructure performing optimally. Logs play a vital role in improving performance, enhancing security, and detecting issues. But at the same time, a lot of people don’t use logs to the best of their ability. This guide will not only introduce you to log management but also reveal which logs to track and what information they are giving to you.
In the domain of cyber threat response, there’s a critical resource that every organization is desperately seeking to maximize: time. It’s not like today’s DevOps teams aren’t already ruthlessly focused on optimizing their work to unlock the greater potential of their human talent. Ensuring your organization to identify and address production issues faster – and increase focus on innovation – is the primary reason why Logz.io and its observability platform exist.
With the recent release of Loki 2.4 and Grafana Enterprise Logs 1.2, we’re excited to introduce a new deployment architecture. Previously, if you wanted to scale a Loki installation, your options were: 1) run multiple instances of a single binary (not recommended!), or 2) run Loki as microservices. The first option was easy, but it led to brittle environments where a heavy query load could take down data ingestion and problems were often difficult to debug.
Istio has quickly become a cornerstone of most Kubernetes clusters. As your container orchestration platform scales, Istio embeds functionality into the fabric of your cluster that makes monitoring, observability, and flexibility much more straightforward. However, it leaves us with our next question – how do we monitor Istio? This Istio log analysis guide will help you get to the bottom of what your Istio platform is doing.
Datadog is one of the most highly rated tools for network monitoring, application performance monitoring & log analysis. The platform is highly rated by engineers for its wide range of useful features, high integrability and support of both custom configurations and reporting dashboards.
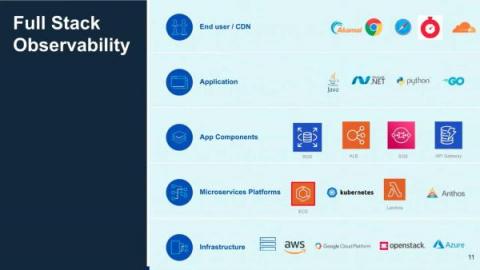
Moving beyond traditional monitoring to embrace full stack observability offers a seemingly endless range of benefits. Beyond unifying logs, metrics, and traces in a single platform, the opportunity to enlist advanced analytics and engage a more predictive approach represents another huge step forward.
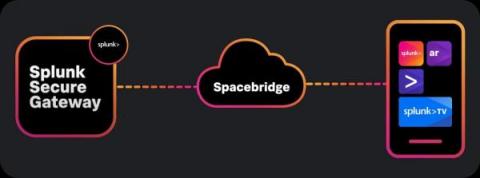
November, the season of post-conf, is upon us. Hopefully all you Splunk admins and sc_admins are craving the release of a ton of new.conf21 Splunk features. Well, good news, because Connected Experiences is here to help you get started with everything Splunk Mobile, Augmented Reality, TV and iPad with this one handy guide. Let’s get started!
While it’s cooling down here in California as Fall arrives, we have some really hot and exciting updates from.conf21, including the announcement of Splunk Cloud Developer Edition, the new Splunkbase user experience, detailed guidelines to help you deliver cloud-ready apps for Splunk Cloud Platform, AppInspect updates with new checks, a helpful blog about storing app secrets, updated docs for Modular Inputs and External Lookups, a summary of SDK updates, and more.
Even if an organization has developed a governance team, aligning integration decisions with business needs must be incorporated into the zero trust architecture. The company’s business model drives the applications chosen. The senior leadership team needs someone who can translate technology risks and apply them to business risks. For example, security might be an organization’s differentiator.
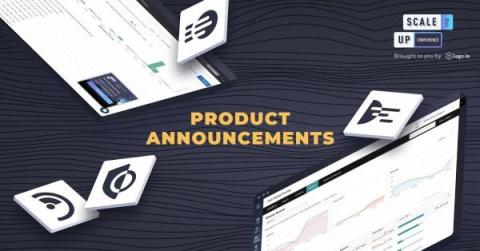
Today was a very exciting day for Logz.io, as we held ScaleUP 2021 – our second annual user conference – dedicated to elevating our customers’ success, discussing best practices for modern observability, and unveiling Logz.io’s latest product updates. These product advancements were presented by our Co-Founder and VP of Product Asaf Yigal, and members of the Logz.io software engineering team.
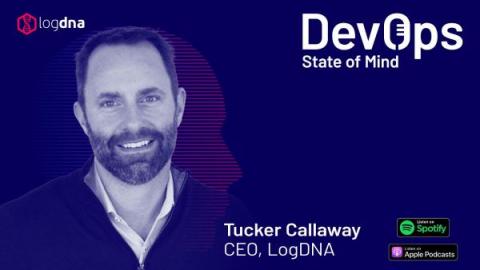
Tucker Callaway is the CEO of LogDNA. He has more than 20 years of experience in enterprise software with an emphasis on developer and DevOps tools. Tucker fosters a DevOps culture at LogDNA by tying technical projects to business outcomes, practicing extreme transparency, and empowering every person in the company to contribute.
In today’s cloud environments, a typical observability stack might include an Elasticsearch cluster for logging, a few Prometheus servers for metrics monitoring, and an AppDynamics deployment for APM. You may run something similar – most observability stacks consist of multiple siloed tools dedicated to collecting and analyzing specific types of monitoring data.
As Logz.io prepares to hold its annual ScaleUP user conference tomorrow, celebrating another amazing year of customer success and continued advancement of our observability platform, we’ve got exciting news to share about our involvement with the OpenSearch project.
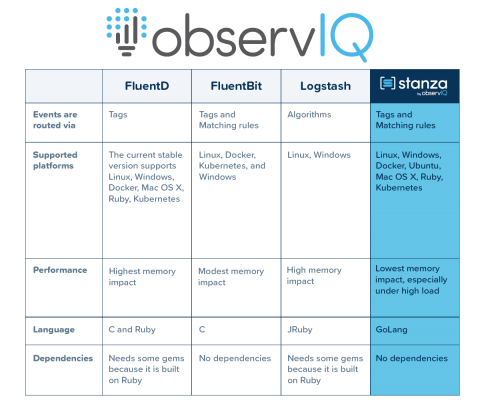
Stanza is a robust log agent. GCP users can use Stanza for ingesting large volumes of log data. Before we dive into the configuration steps, here’s a matrix detailing the functional differences between all the common log agents used by GCP users. Stanza was built as a modernized version of FluentD, Fluentbit, and Logstash. GCP users now have the ability to install Stanza to their VMs/ GKE clusters to ingest logs and route them to GCP log explorer.
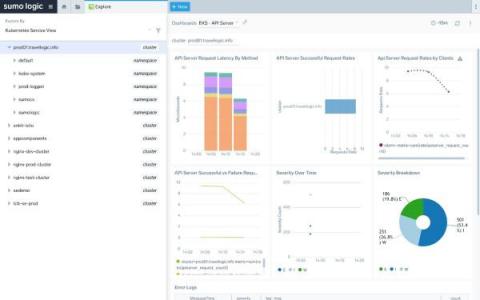
Ask any DevOps engineer, and they will tell you about all the alerts they enable so they can stay informed about their code. These alerts are the first line of defense in the fight for Perfect Uptime SLA. With every good solution out there, you can find plenty of methods for alerting and monitoring events in the code. Each method has its own reasons and logic for how it works and why it’s the best option. But what can you do when you need to connect two opposing methodologies? You innovate!
We're a small team of engineers right now, but each engineer has experience working at companies who invested heavily in observability. While we can't afford months of time dedicated to our tooling, we want to come as close as possible to what we know is good, while running as little as we can- ideally buying, not building. Even with these constraints, we've been surprised at just how good we've managed to get our setup.
Loki 2.4 is here! It comes with a very long list of cool new features, but there are a couple things I really want to focus on here. Be sure to check out the full release notes and of course the upgrade guide to get all the latest info about upgrading Loki. Also check out our ObservabilityCON 2021 session Why Loki is easier to use and operate than ever before.
The need for relevant and contextual telemetry data to support online services has grown in the last decade as businesses undergo digital transformation. These data are typically the difference between proactively remediating application performance issues or costly service downtime. Distributed tracing is a key capability for improving application performance and reliability, as noted in SRE best practices.
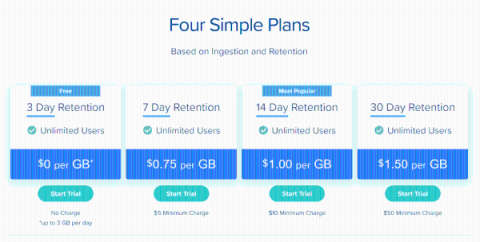
When it comes to comparing all of the best solutions for log management and analysis it can be incredibly difficult to compare key features and pricing per annum side by side to see what solutions you should consider trialling.
At Payoneer, we use Coralogix to collect logs from all our environments from QA to PROD. Each environment has its own account in Coralogix and thus its own limit. Coralogix price modules are calculated per account. We as a company have our budget per account and we know how much we pay per each one. In case you exceed the number of logs assigned per account you will pay for the “extra” logs. You can see the exact calculation in this link.
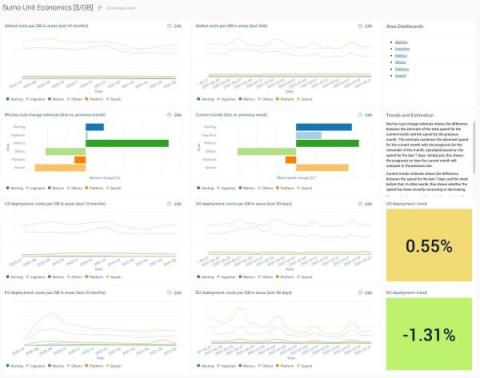
There’s something wrong with the pricing of observability services. Not just because it costs a lot – it certainly does – but also because it’s almost impossible to discern, in many cases, exactly how the costs are calculated. The service itself, the number of users, the number of sources, the analytics, the retention period, and extended data retention, and the engineers on staff who maintain the whole system are all relevant factors that feed into the final expense.
If you’re reading this, I’m pretty sure I don’t need to do much to convince you of the importance of logs. They are the core atomic unit for understanding your environments and provide the insights required to troubleshoot, debug, and more. The fact of the matter is that everyone in your organization needs logs to perform critical functions of their job.
The ELK Stack has millions of users globally due to its effectiveness for log management, SIEM, alerting, data analytics, e-commerce site search and data visualisation. In this extensive guide (updated for 2021) we cover all of the essential basics you need to know to get started with installing ELK, exploring its most popular use cases and the leading integrations you’ll want to start ingesting your logs and metrics data from.
NGINX is a popular web server featuring a wide range of capabilities, including reverse proxy, mail proxy, HTTP cache, and load balancing. It offers TLS offloading and a health check of the backends and supports gRPC, WebSocket, and HTTP/2. In short, NGINX is a one-stop solution for most of your web server needs. When using NGINX, monitoring its metrics is crucial for tackling issues.
If your company works with the US Department of Defense (DoD) as a contractor or subcontractor, you will need to prepare to meet CMMC requirements in order to successfully bid on and win contracts. This recent development has been a significant adjustment for small organisations who wish to work with or continue working with the DoD.
Recently, I explored the case for Graylog as an outstanding means of aggregating the specialized training data needed to build a successful, customized artificial intelligence (AI) project. Well, that’s true, of course. My larger point, though, was that Graylog is a powerful and flexible solution applicable to a very broad range of use cases (of which AI development is just one).
Two popular deployment architectures exist in software: the out-of-favor monolithic architecture and the newly popular microservices architecture. Monolithic architectures were quite popular in the past, with almost all companies adopting them. As time went on, the drawbacks of these systems drove companies to rework entire systems to use microservices instead.
AWS CloudFormation is a service that enables you to create and provision AWS infrastructure deployments predictably and repeatedly. This helps you leverage AWS products such as EC2 instances, Amazon Elastic Block Store, Amazon SNS, Elastic Load Balancing, and Auto Scaling to build highly reliable, highly scalable, cost-effective applications in the cloud – without worrying about creating and configuring the underlying AWS infrastructure.
It’s been a busy couple of months at Logz.io. We’ve added new features, made critical updates, and added a slew of integrations. Those integrations run the gamut from observability and security services, to cloud tools and container orchestration. Let’s take a quick look at what’s new and what’s coming up at Logz.io.
A number of improvements have been made to the Puppet Report Viewer add-on for Splunk since it was initially released. The most notable changes added in version 3.1 of the add-on are the tracked metrics, allowing for better troubleshooting of performance issues in your Puppet installation.
As the world watches the UN Climate Conference unfold in Glasgow, the manufacturing industry is under increased pressure to reduce its CO2 emissions. Companies are stepping up to the challenge, but much more remains to be done to keep climate change under control. Digitalization is part of the solution. The Power of Data has much to offer such as environmentally friendly manufacturing, efficient logistics, improved building and energy management and optimized renewable energy production.