Toil. Few other words have the same visceral impact for SREs as their four-letter nemesis: toil. Although pretty much everyone recognizes and agrees that toil is bad, it is a term that is frequently misused in colloquial use. In common English usage, toil is defined as “long strenuous fatiguing labor”. As a term of art in the SRE profession, “toil” has several very specific characteristics which distinguish it from other sorts of work which people spend time on.
How can enterprises streamline their operations for improved internal efficiency and customer satisfaction? The right combination of DevOps tools will do just that.
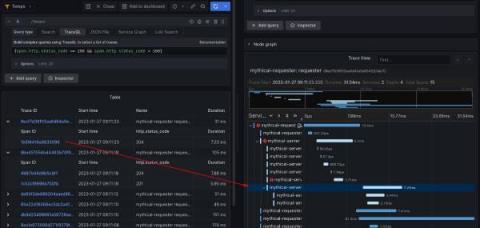
At Grafana Labs, we love tracing, which is why we’ve been hard at work on Grafana Tempo, an open source, highly scalable distributed tracing backend. Tempo just had its 2.0 release. In conjunction with that release, we are excited to show off TraceQL — a powerful new query language designed for distributed tracing. In this blog, we’ll provide an overview of why we created TraceQL, how it works, how you can put it to use today, and what we have planned for future iterations.
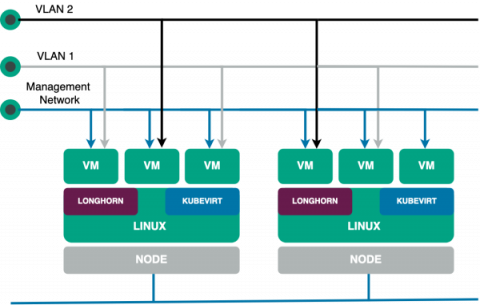
Companies face multiple challenges when migrating their applications and services to the cloud, and one of them is infrastructure management. The ideal scenario would be that all workloads could be containerized. In that case, the organization could use a Kubernetes-based service, like Amazon Web Services (AWS), Google Cloud or Azure, to deploy and manage applications, services and storage in a cloud native environment. Unfortunately, this scenario isn’t always possible.
When adding new Checks in Checkly a number of locations are available to check your endpoints from multiple locations around the world. For most use cases this is more than enough to ensure your resources are online. However, these locations are outside of your network and are unable to check on resources deployed more securely inside your private network.
This is part 2 of a 3-part series on profiling. If you’re not yet familiar with the what profiling is, check out the first part in our series. By this point, you’re probably already convinced that good performance is important for your app’s success. There are many tools available for performance, but profiling in production with a modern profiling tool is one of the easiest and most effective ways to get a full understanding of your app’s performance.