Operations | Monitoring | ITSM | DevOps | Cloud

The latest News and Information on DevOps, CI/CD, Automation and related technologies.

How to Reduce Change Lead Time

The time it takes to get a change into production, also known as Change Lead Time, is an important measure of developer productivity, and one of the four DORA metrics. In Sleuth, you can easily break down Change Lead Time into activities to get insights into potential bottlenecks. SLEUTH A deploy-based Accelerate Metrics tracker both managers and developers love.

Announcing Workflows - Fix k8s issues on the fly

Meet "Workflow" from Komodor, the feature that automates troubleshooting common errors in Kubernetes. Leveraging Komodor’s change intelligence capabilities, Workflow's smart algorithm automatically detects Kubernetes issues and responds with a series of checks that quickly pinpoint its root cause. Not stopping there, Komodor uses the information to provide made-to-measure instruction for remediation, turning troubleshooting into a fast and effortless experience for dev and ops.

Best Practices Guide for Kubernetes Labels and Annotations

Kubernetes is the de facto container-management technology in the cloud world due to its scalability and reliability. It also provides a very flexible and developer-friendly API, which is the foundation of its control plane. The effectiveness of the Kubernetes API comes from how it manages the Kubernetes resources via metadata: labels and annotations. Metadata is essential for grouping resources, redirecting requests and managing deployments.

Mapping FluxCD Applications

Flux is a CNCF based open source stack of tools. Flux focuses on making it possible to keep Kubernetes clusters and cloud-native applications in sync with external resources and definitions hosted in environments such as GitHub. Implementing tools like FluxCD should enable you to achieve results such as: The results above can bring obvious benefits, and many teams are adopting FluxCD as their tool of choice for GitOps.

Data centre networking: what is SDN?

The recent contexts have shown that enterprises needed to take a different approach regarding their digital transformation and its prioritisation. They’ve experienced the need to run new configurations and operations remotely on their infrastructure. This quickly showed the benefits of automation solutions to run those changes from few central locations, which highly facilitated the task of systems and network admins.

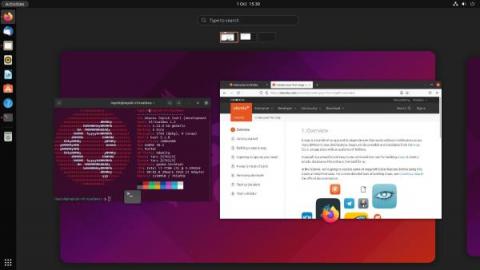
Provisioning bare metal Kubernetes clusters with Spectro Cloud and MAAS

Bare metal Kubernetes (K8s) is now easier than ever. Spectro Cloud has recently posted an article about integrating Kubernetes with MAAS (Metal-as-a-Service. In the article, they describe how they have created a provider for the Kubernetes Cluster API for Canonical MAAS (Metal-as-a-Service). This blog describes briefly the benefits of bare metal K8s, the challenges it presents, and how the work by Saad Malik and the team from Spectro Cloud solves those challenges.

Getting Started With the InfluxDB Template for NGINX Ingress Controller

Today, many of the internet’s busiest websites and applications rely on NGINX to run smoothly. And many of those websites and apps are run as cloud-native services in Kubernetes. In particular, the NGINX Ingress Controller is a best-in-class traffic management solution for cloud‑native apps in Kubernetes and containerized environments that uses NGINX as a reverse proxy, load balancer, API gateway, cache, or web application firewall.

JFrog and Upswift: Bringing IoT Software Updates to DevOps Upswift Acquistion

JFrog has acquired Upswift to bring the world of connected devices into the DevOps pipeline! Managing fleets of devices and edge applications remotely - including over-the-air (OTA) updates, security, monitoring, controlling and more - has quickly become unwieldy for most companies, with growth of connected devices expected to reach 24 billion in 2026. But, most of today’s DevOps solutions are not optimized or built to deliver software updates to distributed edge and IoT environments.

Bootstrapping a multi DC cloud native observability stack by Bram Vogelaar

An introduction to Observability and how to setup a highly available monitoring platform, across multiple data centers. During this talk we investigate how to config a monitoring setup across 2 DCs using Prometheus, Loki, Tempo, Alertmanager and Grafana. Bram Vogelaar spent the first part of his career as a Molecular Biologist, he then moved on to supporting his peers by building tools and platforms for them with a lot of Open Source technologies. He now works as a DevOps Cloud Engineer at The Factory.