Operations | Monitoring | ITSM | DevOps | Cloud

The latest News and Information on DevOps, CI/CD, Automation and related technologies.

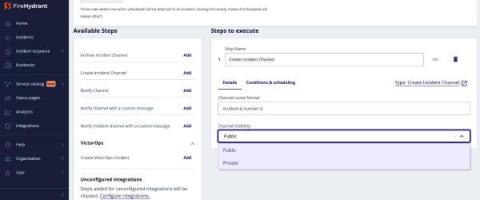
Now Available: Private Slack Channels

Ever heard the saying “Too many cooks”? If you’ve responded to incidents, you’ll likely understand the parallels. There are cases when incident command on a public channel isn’t the best option: Whatever your reason, we’ve got you covered. Now available, users can spin up a private slack channel for an incident. Read more how to do this here.

How We Use Sloth to do SLO Monitoring and Alerting with Prometheus

One of the most challenging tasks for Site Reliability Engineers is to align the reliability of the systems with the business goals. There is a constant battle between delivering more features—which increases the product’s value—and keeping the system reliable and maintainable. A significant ally to achieve both objectives is the Service Level Objective Framework.

Install Netdata to get started monitoring Linux in minutes

Install Netdata to monitor your Linux servers using our one-line installer. Install on physical, virtual, container, and IoT nodes. Netdata’s free, open-source monitoring agent works with Netdata Cloud to help you monitor and troubleshoot every layer of your systems to find weaknesses before they turn into outages.

How to monitor Docker containers using Netdata health and performance

Learn how to connect and claim a Docker node to start monitoring with Netdata in minutes. See information like system CPU, available memory, disk usage, total network bandwidth, and much more. Netdata’s free, open-source monitoring agent works with Netdata Cloud to help you monitor and troubleshoot every layer of your systems to find weaknesses before they turn into outages.

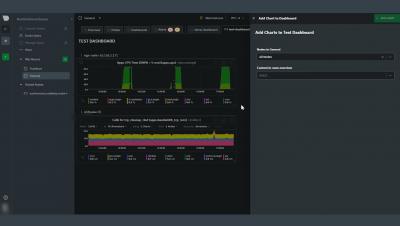
Learn how to build interactive dashboards with Netdata Cloud for troubleshooting systems

This video will show you how to build new dashboards with key metrics from any number of distributed systems in one place for a bird's eye view of your infrastructure. Create more meaningful visualizations for troubleshooting or keep a watchful eye on your infrastructure's most meaningful metrics without moving from node to node. Netdata’s free, open-source monitoring agent works with Netdata Cloud to help you monitor and troubleshoot every layer of your systems to find weaknesses before they turn into outages.

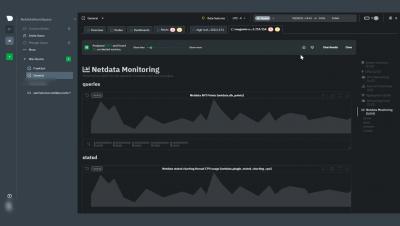
How to use Netdata Cloud for infrastructure observability

In this video, we cover how Netdata Cloud provides scalable infrastructure monitoring for any number of distributed nodes running the Netdata Agent. Monitor any system in your infrastructure including physical or virtual machines (VM), containers, cloud deployments, or edge / IoT devices. Netdata’s free, open-source monitoring agent works with Netdata Cloud to help you monitor and troubleshoot every layer of your systems to find weaknesses before they turn into outages.

Introducing Test Insights with flaky test detection

The CircleCI Insights dashboard was designed to help you improve your delivery efficiency. We launched the dashboard a year ago to provide teams with actionable data for optimizing your pipelines. Since then, we’ve been listening to your feedback. By far, the most requested functionality is the ability to gain further visibility into test performance.

Using Netdata's alerts smartboard for monitoring systems' health and performance

The alerts smartboard gives you high-level information for every node you are monitoring with Netdata Cloud. In this video, you will learn how to navigate through the alerts smartboard as well as what each alert means. Netdata’s free, open-source monitoring agent works with Netdata Cloud to help you monitor and troubleshoot every layer of your systems to find weaknesses before they turn into outages.

Cloud Testing at Facebook

At Speedscale, we are on the cutting edge of defining autonomous testing for the cloud era. However, we aren’t the only company trying to solve this problem and we enjoy learning from every perspective. That’s why Facebook’s recent blog article about autonomous testing caught my eye. They’ve built a sophisticated autonomous test system that introduces many of the same techniques we utilize.

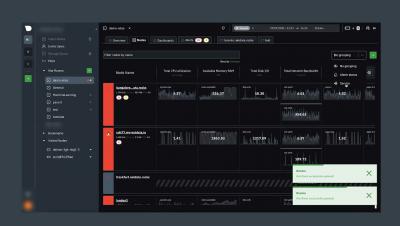
Netdata's Nodes view for troubleshooting system health and performance

This video introduces you to the Netdata Nodes view. Use this view to visualize and customize metrics from any number of Agent-monitored nodes and navigate to any specific nodes within the dashboard. View key monitoring metrics like CPU utilization, memory usage, disk usage, network traffic, and much more to get started troubleshooting performance issues or anomalies. Netdata’s free, open-source monitoring agent works with Netdata Cloud to help you monitor and troubleshoot every layer of your systems to find weaknesses before they turn into outages.