Dashboards

GrafanaCon EU 2018: Using Postgres, Prometheus and Grafana for Storing, Analyzing and Visualizing Metrics

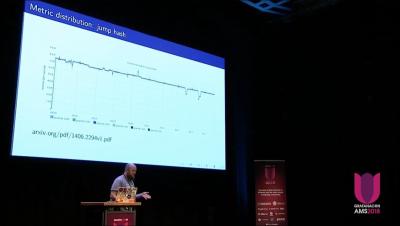
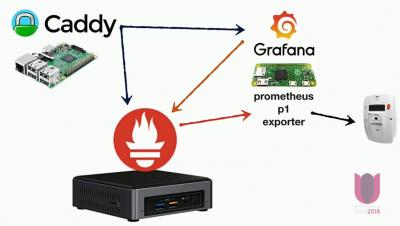
In this talk, we take a somewhat heretical stance in the monitoring world, and describe why and how we chose to use PostgreSQL as a Prometheus backend to support complex queries (and get a full SQL interface).

GrafanaCon EU 2018: Inherited Technical Debt - A Tale of Overcoming Enterprise Inertia

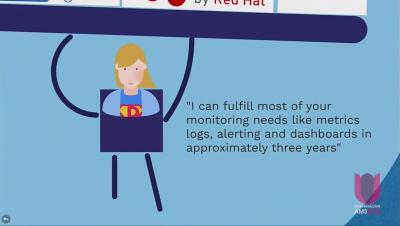
Amgen has been on a journey to confront the multi-million dollar elephant in the room. Technical debt that had been passed down for 10 years in their monitoring portfolio. But how to overcome inertia and a failure to understand how to maximize internal value for data that belongs to organization to begin with?