Operations | Monitoring | ITSM | DevOps | Cloud

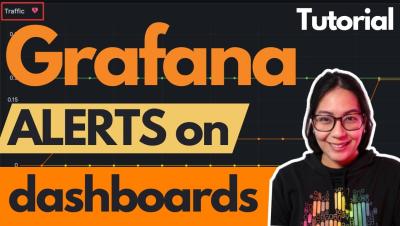
How to Display Grafana Alerts to Your Dashboards | Grafana

💡 Did you know you can display Grafana alerts on your dashboards? Join Senior Developer Advocate Marie Cruz in this quick tutorial to learn how to configure a Grafana alert and link it to your dashboard and panel. ☁️ Grafana Cloud is the easiest way to get started with Grafana dashboards, metrics, logs, and traces.

Grafana 10.4 release: Grafana Alerting improvements, visualization updates, new plugin, and more

Grafana 10.4 is here! The latest version of Grafana introduces feature updates, a new plugin, as well as provides a preview of functionality we intend to make generally available in Grafana 11, which will be featured at GrafanaCON 2024 in April. Download Grafana 10.4 Until then, the Grafana 10.4 release includes upgrades to the canvas, geomap, and table visualizations. There is also a quicker way to set up alert notifications in Grafana Alerting and a new UI for configuring SSO.

Combating IT Alert Fatigue

With the growing complexity of IT systems, managing alerts and notifications without succumbing to the crippling effects of alert fatigue has never been more challenging. Alert Fatigue occurs when the volume of notifications makes it impossible to discern signal from noise, desensitizing the recipient to warnings, some of which end up representing critical issues.