Operations | Monitoring | ITSM | DevOps | Cloud

Latest posts

How to Monitor MongoDB: Key Metrics to Measure for High Performance

Monitoring distributed systems like MongoDB is very important to ensure optimal performance and constant health. But even the best monitoring tool will not be efficient without fully understanding the metrics it gathers and presents, what they represent, how to interpret them, and what they affect. That’s why it is crucial not only to collect the metrics but also to understand them.

Tigera: Addressing IP exhaustion on Microsoft AKS using Calico CNI

Microsoft Azure Kubernetes Service (AKS) provides an integrated CNI to address basic Kubernetes networking requirements, such as configuring network interfaces and providing connectivity between pods. However, the basic container networking in Microsoft AKS comes with a limited set of IP addresses. As businesses grow, so does application usage. Having a limited set of IPs can cause scale, availability, and manageability challenges for Microsoft AKS users.

Tigera: Hands-on workshop: Implementing observability to secure containers and Kubernetes for EKS

Attend this in-depth, hands-on security workshop with Calico and AWS Dev Days experts to get insights into Kubernetes cluster traffic, workload interactions, and security policy enforcement. The 90-minute interactive lab comes with your own provisioned Calico Cloud environment and a sample application. This workshop is designed to provide hands-on experience for you to: We have limited the number of participants for this workshop to ensure that each participant can receive adequate attention.

Tigera: Calico as an operationally simple solution for creating a Kubernetes cluster mesh

Most organizations start and often stay with a single Kubernetes cluster. In Kubernetes literature, the cluster boundary is how far the Kubernetes control plane reaches. However, the usage of Kubernetes, especially at leading-edge organizations operating at scale, has crossed the single-cluster threshold. Organizations are building and deploying services across multiple clusters for high availability, disaster recovery, application isolation, compliance, latency concerns, staged migration, and multi-tenancy reasons.

Understanding the Three Pillars of Observability: Logs, Metrics and Traces

Many people wonder what the difference is between monitoring vs. observability. While monitoring is simply watching a system, observability means truly understanding a system’s state. DevOps teams leverage observability to debug their applications or troubleshoot the root cause of system issues. Peak visibility is achieved by analyzing the three pillars of observability: Logs, metrics and traces.

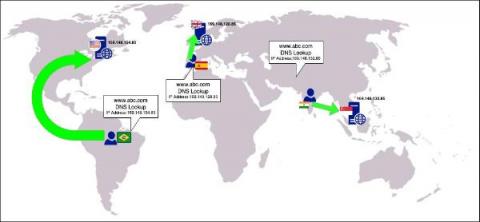
How does GeoDNS work?

Latency is the key differentiator when it comes to application performance on the internet. Reduced latency accelerates the delivery of apps. DNS resolving is the first step towards application delivery and it involves a series of steps. Prior to Anycast DNS, the DNS servers responsible for resolving users’ DNS requests were sitting continents away from many users, contributing to the high latency and slow delivery of applications.


The importance of using the latest browser version for monitoring

Security is one word that is at the tip of everyone’s tongue when it comes to ensuring that web browsers are up to date. In August 2022, after zero day vulnerability CVE-2022-2852 was identified as a critical risk, Google issued a new set of Chrome security updates and tech-industry folks carried on with business as usual. In general, security vulnerabilities of all types are an all-too-common game of Whac-A-Mole. Once a security flaw is discovered and patched, another pops up to take its place.