Operations | Monitoring | ITSM | DevOps | Cloud

Tracing

The latest News and Information on Distributed Tracing and related technologies.

A 5 Minute Guide for Experimenting with Ambassador and Jaeger in a Kubernetes Sandbox

Implementing distributed tracing is fast becoming a fundamental expectation when building modern (distributed) systems. However, this is yet another thing for developers to learn, and configuring distributed tracing on Kubernetes is hard, right? Actually, no. Getting started with Jaeger on Kubernetes has never been easier.

An Introduction to our New Product: Logz.io Distributed Tracing

Yesterday we were excited to announce Logz.io Distributed Tracing, the most recent addition to our Cloud-Native Observability Platform. This is such a special launch for us because it makes Logz.io the only place where engineers can use the best open source monitoring tools for logs, metrics, and traces – known as the ‘three pillars’ to observability – together in one place.

User Experience Monitoring and Synthetics with Elastic Observability

Elastic Observability 7.10 introduces exciting new capabilities that bring deeper visibility into the most important layer of digital monitoring — the experience of the end user. User experience monitoring — accessed via a brand new app in Kibana — provides real-time visibility into website performance, and multistep journey checks in Uptime significantly expand synthetic monitoring capabilities to help operational teams proactively catch issues by monitoring simulated journeys. Plus, several new features like searchable snapshots, out-of-the-box anomaly detection jobs for infrastructure monitoring, and a PHP agent for Elastic APM help the Elastic Observability community optimize costs while deepening visibility across operations.

ScaleUP 2020 Recap: Introducing Distributed Tracing & More

Today was a monumental day for Logz.io and our entire community. There is nothing more inspiring than seeing how people use the technology we’ve built to enhance their businesses. At ScaleUP 2020, our first ever global user conference, we hosted an exciting day of technical, customer-led sessions with our community. We also had the privilege of unveiling some ground-breaking new solutions and enhancements to our end-to-end cloud-native observability platform.

Trace discovery in Grafana Tempo using Prometheus exemplars, Loki 2.0 queries, and more

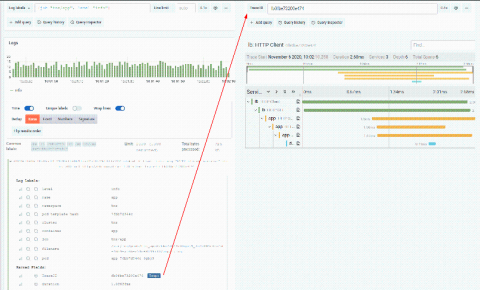
Grafana Tempo, the recently announced distributed tracing backend, relies on integrations with other data sources for trace discovery. Tempo’s job is to store massive numbers of traces, place them in object storage, and retrieve them by id. Logs and exemplars allow users to quickly and more powerfully jump directly to traces than ever before. Let’s dig into some examples with a live playground to try it out!

Introducing etrace - a multi-purpose application profiling tool

These days, the internal workings of Linux applications involve many different moving parts. Sometimes, it can be rather difficult to debug them when things go wrong or run slower than expected. Tracing an application’s execution is one way of understanding potential issues without diving into the source code. To this end, we wrote an app-tracing tool called etrace, designed to detect performance bottlenecks and runtime issues in snaps.

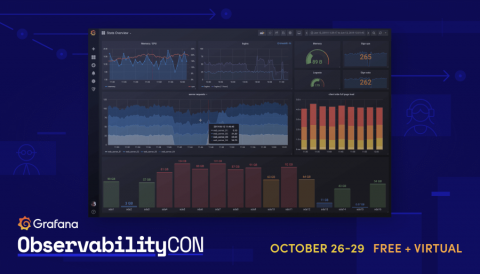
ObservabilityCON Day 3 recap: What's new in Loki 2.0, tracing made easy with Tempo, observability at the Financial Times, and a Minecraft NOC

Today is the last day of ObservabilityCON 2020! We hope you’ve had the chance to catch the talks so far, and will tune in live for today’s sessions. View the full schedule on the event page, and for additional information on viewing, participate in Q&As, and more, check out our quick guide to getting the most out of ObservabilityCON. If you aren’t up-to-date on the presentations so far, here’s a recap of day three of the conference.

Announcing Grafana Tempo, a massively scalable distributed tracing system

Grafana Labs is proud to announce an easy-to-operate, high-scale, and cost-effective distributed tracing system: Tempo. Tempo is designed to be a robust trace id lookup store whose only dependency is object storage (GCS/S3). Join us in the Grafana Slack #tempo channel or the tempo-users google group to get involved today!

Honeycomb Learn Ep. 3: See The Trace? Discover Errors, Latency & More across Distributed Systems

Distributed systems bring complexity for developer and ops teams. When incidents occur in production, expected and unexpected, you want to pinpoint which part of the service is giving problems. Distributed tracing illuminates distributed systems, making your logs easier to navigate. Quickly identify where there are errors or latency in your code or service, even within 3rd party services you use. Instrumentation is the key to the best tracing experience possible.

AWS Distro for OpenTelemetry will send metrics and traces to Datadog

Datadog has a long-standing commitment to open standards. Our integrations with OpenMetrics, JMX, and WMI, as well as our implementation of the tried-and-true StatsD protocol, enable you to collect data with the tools and libraries that fit best into your workflows.