Operations | Monitoring | ITSM | DevOps | Cloud

Tracing

The latest News and Information on Distributed Tracing and related technologies.

Jaeger Essentials: Jaeger Persistent Storage With Elasticsearch, Cassandra & Kafka

Running systems in production involves requirements for high availability, resilience and recovery from failure. When running cloud native applications this becomes even more critical, as the base assumption in such environments is that compute nodes will suffer outages, Kubernetes nodes will go down and microservices instances are likely to fail, yet the service is expected to remain up and running.

Configuring the OpenTelemetry Collector

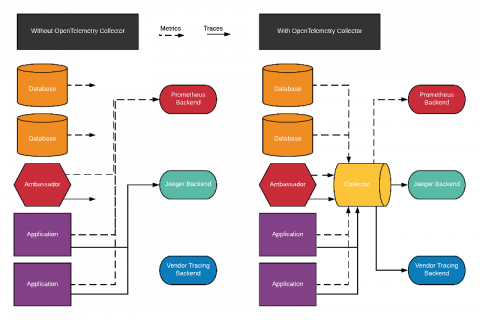
The OpenTelemetry Collector is a new, vendor-agnostic agent that can receive and send metrics and traces of many formats. It is a powerful tool in a cloud-native observability stack, especially when you have apps using multiple distributed tracing formats, like Zipkin and Jaeger; or, you want to send data to multiple backends like an in-house solution and a vendor. This article will walk you through configuring and deploying the OpenTelemetry Collector for such scenarios.

Instant Insights for Troubleshooting Your Spring Boot Applications and Spring Cloud Data Flow Pipelines

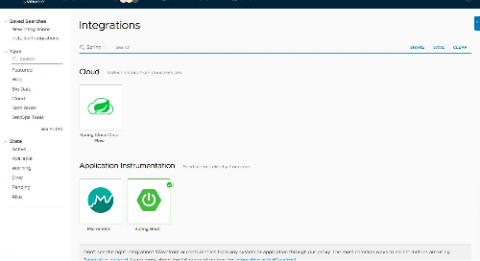
Looking for a way to proactively troubleshoot complex application performance issues? Look no further than Tanzu Observability by Wavefront, which provides easy data ingestion and preconfigured dashboards and can be set up with Spring Boot and Spring Cloud Data Flow (SCDF) integrations.

Splunk Now Top Contributor to OpenTelemetry

Editor’s note: This post is a collaboration between Tim Tully, Splunk CTO, and Spiros Xanthos, Splunk’s vice president of product management for observability and IT Ops and previously the founder and CEO of Omnition. My love for the open-source software movement began with Linux in the ’90s and grew during my time at Yahoo! in the early days of Hadoop.

Interview with Honeycomb Engineer Chris Toshok: Dogfooding OpenTelemetry

At Honeycomb, we talk a lot about eating our own dogfood. Since we use Honeycomb to observe Honeycomb, we have many opportunities to try out UX changes ourselves before rolling them out to all of our users. UX doesn’t stop at the UI though! Developer experience matters too, especially when getting started with observability. We often get questions about the difference between using our Beeline SDKs compared with other integrations, especially OpenTelemetry (abbreviated “OTel”).

NodeJS Instrumentation - Adding Custom Tags to Spans | Datadog Tips & Tricks

In part 1 of this 4 part series, you’ll learn how to use manual instrumentation to add additional detail to traces. We’ll add new tags, or attributes, to the spans generated by our NodeJS application, allowing for more insightful data visualizations in App Analytics.

NodeJS Instrumentation - Creating Custom Spans for Method-Level Visibility | Datadog Tips & Tricks

In part 2 of this 4 part series, you’ll learn how to instrument your NodeJS application to capture custom method-level spans, allowing visibility into how specific methods behave in your application. Flame graphs allow for deep insight into the performance of your code. During instrumentation, we can capture custom spans for deeper layers of visibility in the resulting flame graphs. In this video, we use instrumentation to capture a method-level span, allowing us to see the performance of that specific method in our flame graphs in the Datadog UI.

NodeJS Instrumentation - Adding Analyzed Spans for Improved Data Analytics | Datadog Tips & Tricks

In part 4 of this 4 part series, you’ll learn how to add Analyzed Spans to your traces to open up even more data search and aggregation capabilities via App Analytics. In this video, we will walk you through how you can turn any span into an Analyzed Span. Analyzed Spans function like the root spans of a trace, allowing us to turn the tags embedded in them into facets for advanced data aggregation and searching in App Analytics. You can check out how to add tags to spans—and how to utilize them in App Analytics—in our first video of the series here.

Debugging, distributed tracing, and profiling for web applications

Google Cloud offers many tools that can help you manage your application services. In this video, we teach you how to set up and utilize Cloud Trace, Cloud Profiler, and Cloud Debugger to collect latency data across different services, memory-allocation information, and inspect application code locations without compromising the performance of your web application.