Operations | Monitoring | ITSM | DevOps | Cloud

Blog

How to SSH into Docker containers

A Docker container is a portable software package that holds an application’s code, necessary dependencies, and environment settings in a lightweight, standalone, and easily runnable form. When running an application in Docker, you might need to perform some analysis or troubleshooting to diagnose and fix errors. Rather than recreating the environment and testing it separately, it is often easier to SSH into the Docker container to check on its health.

Are You Struggling to Break Through the Growth Barrier With Your MSP?

The vast majority of MSPs in the world are under $2milion in revenue. Breaking through that barrier is not easy. As part of our business transformation program, we see a large number of MSPs that have been going for more than 10 years but can’t seem to push through to the next level. Often these MSP businesses are stuck in the $800k-$2M turnover range with around five to 15 techs working for them.

Build a Data Streaming Pipeline with Kafka and InfluxDB

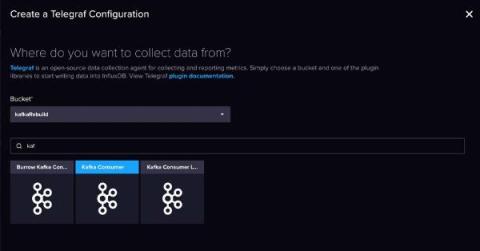
InfluxDB and Kafka aren’t competitors – they’re complimentary. Streaming data, and more specifically time series data, travels in high volumes and velocities. Adding InfluxDB to your Kafka cluster provides specialized handling for your time series data. This specialized handling includes real-time queries and analytics, and integration with cutting edge machine learning and artificial intelligence technologies. Companies like as Hulu paired their InfluxDB instances with Kafka.

Product Spotlight: Enhancing Incident Resolution with Blameless' Microsoft Teams Integration

In today's fast-paced digital landscape, swiftly responding to incidents is paramount for engineering teams. Downtime is not just costly; it can tarnish your organization's reputation. The pressure felt by engineering operations, DevOps, and SRE leaders to architect and run an effective incident response process is immense. Fortunately, over the last several years, effective engineering organizations have developed a standard toolkit for running a good incident response process.

The CEO Pocket Guide to Internal Developer Portals

In the current macroeconomic climate, it’s more important than ever for executive teams and CEOs to make the most of their resources. Organizations are expected to continually deliver innovative products and services in a rapidly changing environment, often with reduced engineering budgets. 75% of tech leaders fear displacement from competitors beating them to market, so speed and efficiency are top of mind.

APM Today: Application Performance Monitoring Explained

Application Performance Monitoring (APM) is a technology approach that provides real-time information about how your software applications are performing. With a comprehensive view into application health and availability, APM can do things like: Both the importance and the usage of APM has grown in recent years. That’s because companies rely on increasingly complex applications to run their businesses. Here is what you need to know about Application Performance Monitoring.

How Uptime.com and Logz.io Can Streamline Website Monitoring

Maintaining the right combination of tools and integrations is essential in monitoring your online presence. To this end, Logz.io and Uptime.com — both highly-respected services in their own right — can be integrated to provide powerful analytics, uptime metrics monitoring, log management, and real-time incident alerts – all in one dashboard.

Elastic SQL inputs: A generic solution for database metrics observability

Elastic® SQL inputs (metricbeat module and input package) allows the user to execute SQL queries against many supported databases in a flexible way and ingest the resulting metrics to Elasticsearch®. This blog dives into the functionality of generic SQL and provides various use cases for advanced users to ingest custom metrics to Elastic®, for database observability. The blog also introduces the fetch from all database new capability, released in 8.10.

Using Cribl Stream to Correct Misconfigured Data in Datadog

The challenge for every organization is gathering actionable observability information from all your systems, in a timely manner, without creating a substantial operational burden for the teams managing the collection tooling. While each observability solution has its unique benefits and challenges, the one common burden expressed by teams is the management of the metadata of the metrics, traces, and logs.