Operations | Monitoring | ITSM | DevOps | Cloud

Blog

Monitoring Kubernetes with Graphite

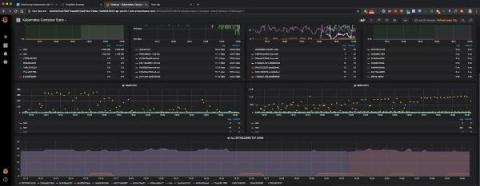
In this article, we will be covering how to monitor Kubernetes using Graphite, and we’ll do the visualization with Grafana. The focus will be on monitoring and plotting essential metrics for monitoring Kubernetes clusters. We will download, implement and monitor custom dashboards for Kubernetes that can be downloaded from the Grafana dashboard resources. These dashboards have variables to allow drilling down into the data at a granular level.

Monitoring virtual machines with Prometheus and Graphite

Virtual machines give you a flexible and convenient environment where people can access different operating systems, networks, and storage while still using the same computer. This prevents them from purchasing extra machines, switching to other devices, and maintaining them. This helps companies to save costs and increase task efficiency. Although using VMs for everyday tasks may be enjoyable, ensuring consistent performance and performing maintenance can be daunting.

Sponsored Post

The Future of SQL Sentry

This month, I celebrate 11 years of working on SQL Sentry. I started as employee number 15 at SentryOne and then moved through various roles in support, customer success, and professional services to my current role as product manager. In an industry where innovation and adaptation are key, the journey of SQL Sentry and its team has been remarkable. SQL Sentry has come a long way since its early days.

How to monitor Python Applications with Prometheus

Prometheus is becoming a popular tool for monitoring Python applications despite the fact that it was originally designed for single-process multi-threaded applications, rather than multi-process. Prometheus was developed in the Soundcloud environment and was inspired by Google’s Borgmon. In its original environment, Borgmon relies on straightforward methods of service discovery - where Borg can easily find all jobs running on a cluster.

The connection between incident management and problem management

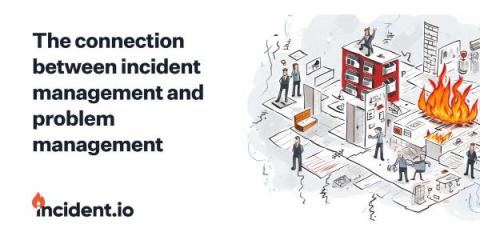
Sometimes, two concepts overlap so much that it’s hard to view them in isolation. Today, incident management and problem management fit this description to a tee. This wasn’t always the case. For a long time, these two ITIL concepts were seen as distinct—with specialized roles overseeing each. Incident management existed in one corner and problem management in the other. Then came the DevOps movement and the lines suddenly became blurred. So where do they stand today?

ECS Vs. EC2 Vs. S3 Vs. Lambda: The Ultimate Comparison

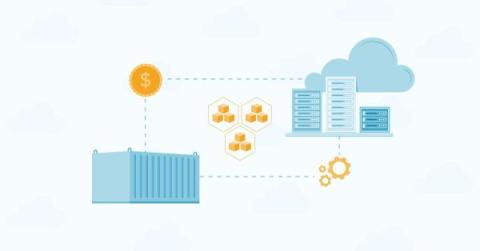
Amazon Web Services (AWS) offers over 200 fully-featured services. AWS Elastic Compute Cloud (EC2), Elastic Container Service (ECS), Amazon Lambda, and the AWS Simple Storage Service (Amazon S3) are some of the most critical services you should become familiar with. We’ve covered Amazon ECS vs. EKS vs. Fargate for managing and deploying containers before. In this guide, we'll explain how Amazon EC2, Lambda, ECS, and S3 compare and when you’ll want to use each.

Internal Developer Platform vs Internal Developer Portal: What's The Difference?

In the evolving landscape of software development, two terms frequently emerge: "Internal Developer Platform" (IDP) and "Internal Developer Portal". These terms are often used interchangeably, leading to confusion. In this article, we aim to differentiate the two and highlight their importance in modern software engineering.

David Foxen on IT Asset Management Challenges, Opportunities, and Strategies

Are you ready to tackle the hidden IT Asset Management (ITAM) challenges that could impact your organization's efficiency and success? In this dynamic field, continuous learning is not just an option; it's a necessity. To equip you with insights, we delved into “ITAM Challenges: Epic Fails, Red Flags, And Tales From the Battlefield” during September's Ticket Volume podcast live recording.

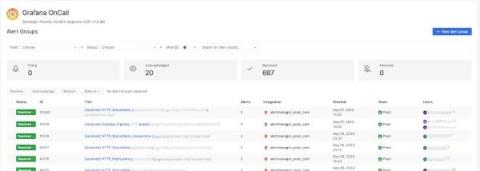
Inside Prezi's cost-saving switch to Grafana Alerting, Grafana OnCall, and Grafana Incident from PagerDuty

Alexander is Senior SRE at Prezi, a video and visual communications software company. As a team, the Prezi SREs provide multiple services within the company. One of those is the observability stack where Prezi heavily relies on Grafana. Companies are always evolving to run more smoothly, serve their customers better, and operate in a way that is cost-effective.