Operations | Monitoring | ITSM | DevOps | Cloud

Blog

Better Observability with New Container Agents

If you liked Sematext Docker Agent you’ll love our new agent for Docker monitoring that provides you with even more insight into your Docker, Kubernetes, and Swarm clusters. Because of its power, small footprint, and ease of installation the old Sematext Docker Agent enjoyed high adoption by the Docker DevOps community.

DevOps & SRE: Two Sides of the Same Coin?

Large organizations that wish to scale at an aggressive pace need IT departments that can be both nimble and agile. With DevOps and site reliability engineering (SRE) methodologies, IT teams can improve the agility, availability and performance of applications and services in their infrastructure. For those who are new to both concepts, here is a primer on how DevOps and SRE can work together to evolve IT operations.

Thanks, Gartner! We're in the 2019 Magic Quadrant for APM

It’s raining accolades for ManageEngine Applications Manager, and we’re psyched! After being named a January 2019 Gartner Peer Insights Customers’ Choice for Application Performance Monitoring Suites, Gartner has also recognized Applications Manager as a niche player in its 2019 Magic Quadrant for Application Performance Monitoring.

The Business Case for Container Adoption

Developers often believe that demonstrating the need for an IT-based solution should be very easy. They should be able to point to the business problem that needs a solution, briefly explain what technology should be selected, and the funds, staff, and computer resources will be provided by the organization. Unfortunately, this is seldom the actual process that is followed.

How to Monitor Amazon EC2 with CloudWatch

Amazon EC2 allows you to spin up servers for your application without having to actually manage physical hardware. However, since it’s a managed service, you have less visibility with traditional monitoring tools. As such, it becomes even more important to take advantage of the available monitoring tools in AWS. In this post, we’ll explain how to use CloudWatch to monitor EC2 and what is important to watch.

Grafana Plugin Tutorial: Polystat Panel (Part 1)

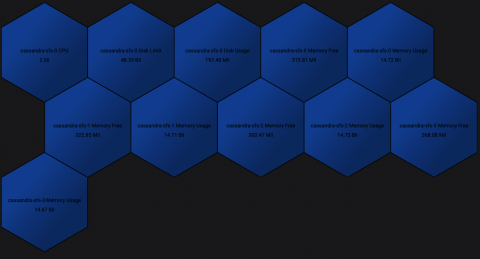
The grafana-polystat-panel plugin was created to provide a way to roll up multiple metrics and implement flexible drilldowns to other dashboards. This example will focus on creating a panel for Cassandra using real data from Prometheus collected from our Kubernetes clusters. We’ll focus on the basic metrics for CPU/Memory/Disk coming from cAdvisor, but a well-instrumented service will have many metrics that indicate overall health, such as requests per second, error rates, and more.

Installing the EFK Stack with Kubernetes with GKE

The ELK Stack (Elasticsearch, Logstash and Kibana) is the weapon of choice for many Kubernetes users looking for an easy and effective way to gain insight into their clusters, pods and containers. The “L” in “ELK” has gradually changed to an “F” reflecting the preference to use Fluentd instead of Logstash and making the “EFK Stack” a more accurate acronym for what has become the de-facto standard for Kubernetes-native logging.

How to Troubleshoot Java Application Slowness Using Java Transaction Tracing

The performance of any application is measured by its availability and responsiveness. When an application is slow, IT operations staff must troubleshoot the cause of slowness, identify it and resolve it. While application performance problems may be caused by issues in the supporting infrastructure, often the issues are related to the application components themselves.

Spring 2019 Release Overview: The Intelligent Enterprise

In today’s always-on digital world, business stakeholders and technical responders across the enterprise must understand the health of their digital services at all times so they can take action immediately when disruptions happen. Yet with operational complexity increasing by 3x per responder on average over the past three years, it’s becoming increasingly difficult for teams to make sense of data and surface meaningful insights to improve digital operations.