Operations | Monitoring | ITSM | DevOps | Cloud

Blog

Elasticsearch Ingest Node vs Logstash Performance

Starting from Elasticsearch 5.0, you’re able to define pipelines within it that process your data, in the same way you’d normally do it with something like Logstash. We decided to take it for a spin and see how this new functionality (called Ingest) compares with Logstash filters in both performance and functionality. Is it worth sending data directly to Elasticsearch or should we keep Logstash?

Alert fatigue, part 4: alert consolidation

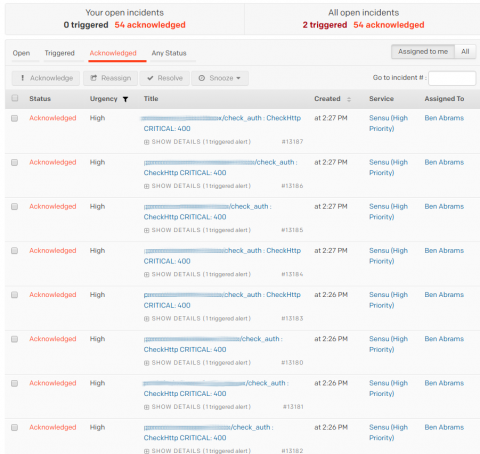
So far, we’ve covered alert reduction with Sensu filters and token substitution; automating triage; and remediation with check hooks and handlers (links above). In this post, I’ll cover alert consolidation via round robin subscriptions and JIT/proxy clients; aggregates; and check dependencies. These are all designed to help you cut through the “white noise” and focus on what’s important (especially in the middle of a major incident).

Automatically Map, Visualize and Troubleshoot Your Citrix Infrastructure with Topology View

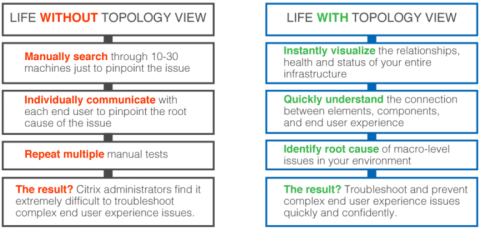
One of the single biggest issues that Citrix administrators are forced to deal with is the sheer complexity of their Citrix systems. Not only is there complexity associated with the Citrix software itself, but the Citrix software also has a dependency upon a number of supporting infrastructure components. All of this complexity can make troubleshooting extraordinarily difficult whenever problems arise. An inexperienced administrator may not even know where to start.

EKS vs. KOPS

In the past, applications would be deployed by installation on a host, using the operating system package manager. This was a heavy solution with tremendous reliance on the operating system package manager and increased complexity with libraries, configuration, executables and so on all interconnected. Then came containers. Containers are small and fast, and are isolated from each other and from the host.

Reserved Instances: Use It or Lose It

Reserved instances are one of those things that, when you first hear about them, you say, “Wow! I could save a lot of money!” And then you start to try and figure out how many you need? What sizes? Which operating systems? In which regions? Should they be convertible? Should I choose a 1-year or 3-year term? All up-front, partial up-front, or no up-front? How much compute am I actually going to need over that term?

Unsung IT Ops and DevOps heroes are finally getting their due!

IT Ops and DevOps teams in every organization are capable of focusing on revenue-generating initiatives and projects. Unfortunately they’re held back by constant fire-fighting…which means they are reduced to supporting just the current state and existing/legacy applications and services.

Best Practices for Instrumenting Containers with AppDynamics Agents

In this blog I will show some best practices for instrumenting Docker containers, using docker-compose with a few popular AppDynamics application agent types. The goal here is to avoid rebuilding your application containers in the event of an agent upgrade, or having to hard-code AppDynamics configuration into your container images. In my role as a DevOps engineer working on AppDynamics’ production environments, I use these techniques to simplify our instrumented container deployments.

Monitor Postgres Disk Space Usage with Foglight

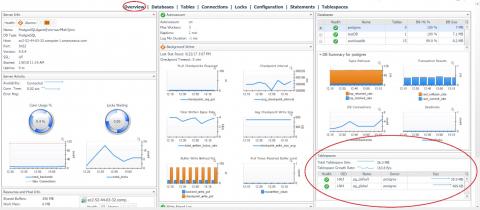
Many things can happen if the database runs out of disk space. None of them are good. DBAs understand that it is essential to monitor database disk space so that critical business processes are uninterrupted. Quest’s Foglight provides peace of mind by monitoring that space and alerting on the threshold well in advance of potential space issues.