Operations | Monitoring | ITSM | DevOps | Cloud

Blog

4 Reasons Why Your Source Maps are Broken

Source maps are awesome. Namely, because they are used to display your original JavaScript while debugging, which is a lot easier to look at than minified production code. In a sense, source maps are the decoder ring to your secret (minified) code. However, they can be tricky to get working properly. If you’ve run into some trouble, the tips below will hopefully help you get everything in working order.

Icinga 2.10.1 bugfix release

The namespace support in 2.10 caused a regression with the registered global scope being evaluated for API permissions with filters. This release fixes the problem, next to a problem with Windows packages not fully starting up. There’s also a fixed oversight with not setting a default environment constant. This affects setups checking the SNI header in external load balancers.

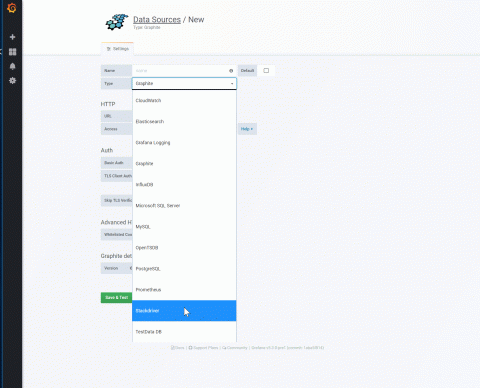
Introducing Stackdriver as a data source for Grafana

It is not uncommon to have multiple monitoring solutions for IT infrastructure these days as distributed architectures take hold for many enterprises. We often hear from Google Cloud Platform (GCP) customers that they use Stackdriver to monitor resources as well as Grafana and Prometheus for container monitoring. We’ve heard lots of requests from customers to be able to view Stackdriver data in Grafana effortlessly.

Have we discovered the secret sauce for successful offsites?

Offsite meetings can be great for getting things done. Being out of the office can clear the cobwebs, break down barriers, and lead to real breakthroughs. At BigPanda, the marketing team has started experimenting with how we run offsites, with the aim of trying to find a “secret sauce” that leads to success – maximizing both team building and task execution that we tackle in our offsites.

Your Journey to the Cloud - 5 Essential Facts About Zenoss + Nutanix

Growing up in Seattle, Washington, I had access to some of the best hiking in the world. If you want take on a challenge and climb a peak, then the Cascade and Olympic mountain ranges provide a variety of journeys for everyone regardless of skill level and starting point. We were taught at a very young age that everyone needed certain “essentials” before setting out to ensure safety and success.

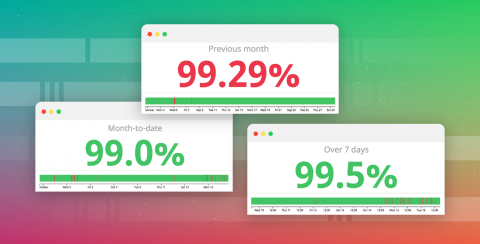
Track the status of your SLOs with the new monitor uptime widget

Service level objectives are an important tool for maintaining application performance, ensuring a consistent customer experience, and setting expectations about service performance for both internal and external users. We are very pleased to announce the availability of a new monitor uptime widget that makes it simple to monitor the status of your SLOs and communicate that status to your teams, executives, or external customers.

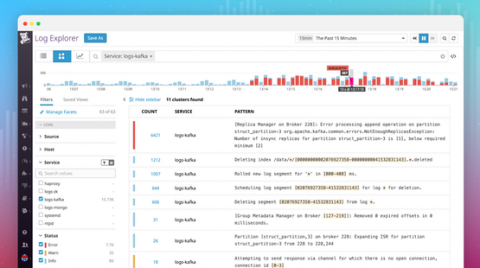
Log Patterns: Automatically cluster your logs for faster investigation

Sifting through all your logs to find what you need can be challenging—especially during an outage, when time is critical and you’re flooded with WARN and ERROR messages. To help you immediately surface useful information from large volumes of logs, we developed Log Patterns.

Challenges and Solutions for Scaling Kubernetes in the Hybrid Cloud

When traffic increases, we need to have a way to scale our application to keep up with user demand. With Kubernetes multi-cluster management through Rancher, scaling has never been easier and more efficient. Read here about scaling Kubernetes and the challenges you might be facing when managing a hybrid cloud environment.