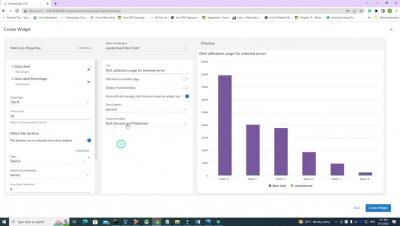
Building a context-driven dashboard
Building a context-driven dashboard including utilization forecast for windows servers in ScienceLogic.


When Azure AD is configured to record Sign-In activity, Kusto KQL can be used to gain valuable insights. This blog walks through common needs and shows how to visualize them in SquaredUp. Ruben Zimmermann is an Infrastructure Architect at a large manufacturing company who likes Azure, KQL, PowerShell and, still, SCOM.
To ensure the best possible end-user experience, engineering teams must be able to seamlessly transition from performance testing to problem resolution, breaking down any silos that exist between the two. That’s why, earlier this year, Grafana Labs launched Grafana Cloud k6, a unified platform that natively integrates the Grafana k6 performance testing experience directly into Grafana Cloud.
Patrick DeVivo is a software engineer and founder of MergeStat, an open source project that makes it possible to query the contents, history, and metadata of source code with SQL. The security posture of software supply chains has been a significant topic lately. Recent high-profile breaches have shown the importance of managing risks from third party code. Take, for example, the Log4Shell vulnerability (tracked as CVE-2021-44228 — Grafana Labs was not affected).
It is an old cliche adage, but there is no better statement than “a picture is worth a thousand words” that explains the effectiveness of visuals to deliver a message. Especially, in the data domain where a raw message often exists in numbers, visualizing graphs and charts is the best way to share information. When it comes to visualizing metrics from Graphite, there is no solution that can beat Grafana.
Snowflake is a cloud-based data warehousing platform that allows organizations to store, manage, and analyze large amounts of data. It offers a scalable, secure, and highly available solution that separates storage and computing resources. We already offer the Snowflake datasource plugin, which allows you to query and visualize data from your Snowflake Data Cloud on your Grafana dashboards.
Since Kubernetes Monitoring launched in Grafana Cloud last year, we have introduced highly customizable dashboards and powerful analytics features. We’ve also focused on how to make monitoring and managing resource utilization within your fleet easier and more efficient. But what’s an easy way to add resources to your cluster while using Kubernetes Monitoring?
As the largest liquidity network in crypto, Paradigm facilitates more than $11 billion in monthly volumes, representing nearly 40% global cryptocurrency option flows. Their free-to-use platform provides a single point of access to multi-asset, multi-instrument liquidity on demand, and Software Architect Jameel Al-Aziz leads the team of developers who build and maintain the platform.
GitLab is a popular open source DevSecOps platform for software development. The Enterprise Edition is a web-based Git repository manager that allows teams to collaborate on code and automate workflows for building, testing, and deploying applications. We already offer the Gitlab datasource plugin, which allows you to query and visualize data from your GitLab instance on your Grafana dashboards.
Because of where you’re reading this post, I’m going to assume you already know that Grafana is a great tool for visualizing and presenting metrics, and persisting them on dashboards. Ever since the Grafana Loki query builder for LogQL was introduced in 2022, it’s been easy to display and visualize logs, too.


