Operations | Monitoring | ITSM | DevOps | Cloud

Analytics

How to Monitor Azure Services with Sumo Logic

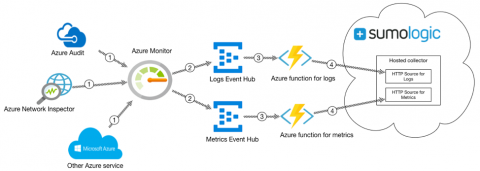
This week at the Microsoft Ignite, we unveiled two new Sumo Logic applications for Microsoft Azure services — Azure SQL Database and Azure Active Directory — and two new native integrations with Azure Monitor and Blob Storage. As a cloud-native company, our goal at Sumo Logic is to give our customers the flexibility to create digital IT and DevOps initiatives that leverage multi-cloud deployments in Amazon Web Services (AWS), Google Cloud Platform (GCP) and Microsoft Azure.

Cloud Complexity Management, a New Need for 2019

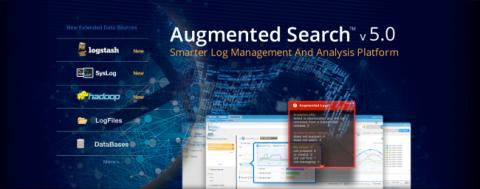
A cloud complexity crisis is going to happen. We’re adding hundreds of workloads to the cloud on a daily basis, standing up new databases, adding different types of compute and storage, and adding cloud-based networks—and doing all of this without taking down almost no existing on-premises resources.

Quantifying WordPress Performance Improvements with circonus-logwatch

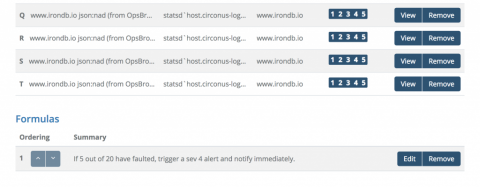
Deriving meaningful insights from third-party logs has always been a difficult yet necessary task. Most analysis occurs after-the-fact, when something has gone wrong. Very few tools allow real-time monitoring of logs, so SREs have become accustomed to backfilling log data into various analysis tools. Postmortem log analysis is the de facto standard, yet should it be? Why shouldn’t you be able to monitor your server logs in real-time?

Grafana's Explore UI: Taking a Deeper Dive into Data with Prometheus Queries

When there’s an incident, Grafana is often the starting point for figuring out a response. Users look at a time series panel and form a hypothesis. And in many situations, they’d like to dive deeper. To help make that easier, Grafana Labs has created the Explore UI, which allows you to iterate quickly through Prometheus queries, while leaving your dashboards intact.

Grafana as a Yet Another Tool for Technical Monitoring of Software Products We Build

One more article in Logicify Monitoring Tools series talks about Grafana, a software we use both for internal and external projects to visualize and analyze the data. The article could be of interest to CTOs, developers and DevOps, system administrators and Project Managers, and everyone interested.

Honeycomb vs Elastic Stack: It's about priorities

If you’ve been paying attention, you know that although collecting and reviewing metrics and logs is a core part of running a stable and successful service, access to raw events and the ability to search and pivot on any dimension of your production environment, no matter how high-cardinality, is what will help your team debug and troubleshoot new problems and outages more quickly.

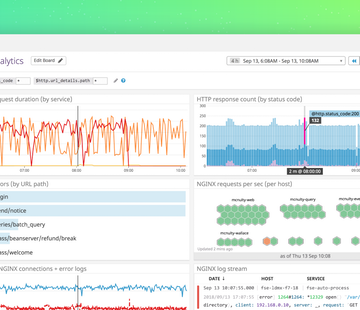
Log analytics and dashboarding in Datadog

Achieving optimal performance can be challenging when you depend on separate platforms to monitor service health and to manage your logs. When data about your systems is spread across multiple platforms, investigating issues—and ultimately resolving them—takes longer and requires expertise with more tools. It takes more effort to identify real customer impact, as well as to verify that your responses to an incident are having the desired effect.