Operations | Monitoring | ITSM | DevOps | Cloud

Logging

The latest News and Information on Log Management, Log Analytics and related technologies.

An Introduction to the OWASP API Security Top 10

If you ever watched Stargate, then you have some understanding of how application programming interfaces (APIs) work. While APIs don’t give you the ability to traverse the galaxy using an alien wormhole, they do act as digital portals that allow data to travel between applications. However, as sensitive data moves from one application to another, each API becomes a potential access point that threat actors can exploit.

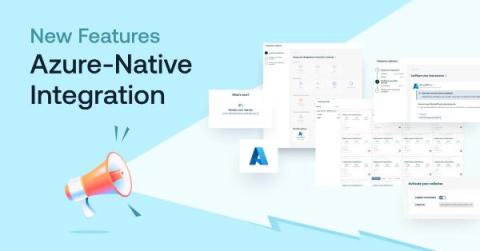
Simplify Azure Monitoring with Logz.io's New Azure-Native Integration

If you’re looking to monitor Microsoft Azure infrastructure with Logz.io, we’re now making it easier than ever with our new Azure-native integration Typically, collecting infrastructure metrics from Azure involves installing and configuring data collection components on your system, such as Prometheus, Telegraph, or a number of proprietary agents that are specific to different vendors.

12 DevOps Best Practices Teams Should Follow

DevOps is a software development philosophy that helps organizations achieve faster delivery, better quality, and more reliable software, making it easier to adapt to changing business needs and customer demands. However, implementing DevOps can be challenging on many levels. It requires changes in culture, processes, skills, knowledge, and tools, which can encounter resistance from traditional silos within organizations. So, how can you successfully implement DevOps within an organization?

Failure Metrics & KPIs for IT Systems

The game in enterprise IT is this: delivering amazing services to your customers while also reducing costs. That means the time it takes to respond to an incident is critical. Incidents can ruin service delivery and destroy your budget. Certain incidents almost surely deliver a poor customer experience. Response times, you hear? Yep, we’re talking about MTTR, but that’s not all.

Your Self-Managed Journey to Digital Resilience

If you were one of the thousands of Splunk customers who joined us this year at.conf23, you heard our CEO Gary Steele say that Splunk's mission is to help you be digitally resilient. (And don't worry if you couldn't join us, because you can catch the keynote replays.) But what is digital resilience and how do you attain it?

The 12 Cats of Observability

On the surface, business-critical IT infrastructure and cats may not seem like they have a lot in common. But they’re way more alike than you might think. Our feline friends contain multitudes, as any cat parent will tell you. They’re complex and can sometimes drive you up a wall. But once they warm up to you—and you warm up to them—the joys and benefits of having them in your life outweigh just about everything. Sounds a lot like technology, right?

What to Do When You Have 1000+ Fields?

So you have been adding more and more logs to your Graylog instance, gathering up your server, network, application logs, and throwing in anything else you can think of. This is exactly what Graylog is designed for, to collect all the logs and have them ready for you to search through in one place. Unfortunately, during your administration of Graylog, you go to the System -> Overview screen and see the big bad red box, saying you are having indexing failures.

How to Manually Instrument Java with OpenTelemetry (Part 1)

In this tutorial, we'll be diving into the world of OpenTelemetry and its application in Java. We'll take you step-by-step through the process of manually instrumenting a Spring Boot application.OpenTelemetry is an observability framework for cloud-native software and a powerful tool for capturing distributed traces and metrics from your application. This video will equip you with the knowledge and practical skills to utilize OpenTelemetry effectively and take your application monitoring to the next level.

How to Manually Instrument Java with OpenTelemetry (Part 2)

Part 2 video on OpenTelemetry (Otel) Instrumentation for Java is out now! Building upon the solid foundation we set in the first video, this installment takes a deep dive into the realm of backend calls, with a particular focus on Redis databases. We'll also explore the power and utility of the Tracing Filter - an essential tool for efficient monitoring and troubleshooting in distributed systems.

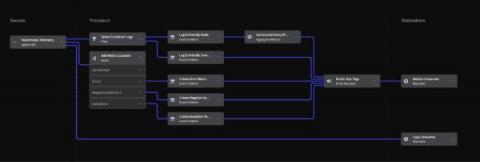
Understand Your Kubernetes Telemetry Data in Less Than 5 Minutes: Try Mezmo's New Welcome Pipeline

Most vendor trials take quite a bit of effort and time. Now, with Mezmo’s new Welcome Pipeline, you can get results with your Kubernetes telemetry data in just a couple of minutes. But first, let’s discuss why Kubernetes data is such a challenge, and then we’ll overview the steps.