Fully Correlated Serverless Observability
Coralogix offers native dashboards for Serverless infrastructure, with a tracing and APM featureset that provides even the most minute detail of your Serverless application stack.


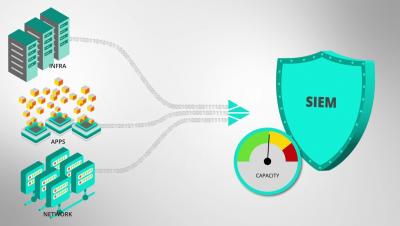
The latest News and Information on Observabilty for complex systems and related technologies.
You know the old saying, I’m sure: “April deploys bring May joys.” Okay, maybe it doesn’t go exactly like that, but after reading what we’ve been up to for the past month, I think it might be time for an update. Let’s dive into our Feature Focus April 2023 edition.
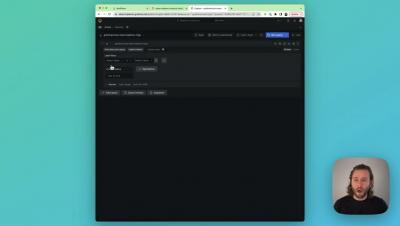
Code instrumentation is closely tied to debugging. Ask one of the experienced developers and they will swear by it for their day-to-day debugging needs. With modest beginnings in the form of print statements that label program execution checkpoints, present-day developers employ a host of advanced techniques for code instrumentation. When carried out in the right way, it improves developer productivity and also reduces the number of intermediate build/deployment cycles for every bug fix.
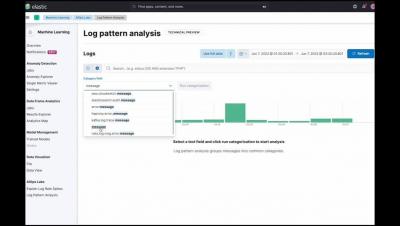
Elasticsearch is used for a wide variety of data types — one of these is metrics. With the introduction of Metricbeat many years ago and later our APM Agents, the metric use case has become more popular. Over the years, Elasticsearch has made many improvements on how to handle things like metrics aggregations and sparse documents. At the same time, TSVB visualizations were introduced to make visualizing metrics easier.
Cloud native is the de facto standard approach to deploying software applications today. It is optimized for a cloud computing environment, fosters better structuring and management of software deployments. Unfortunately, the cloud native approach also poses additional challenges in code instrumentation that are detrimental to developer productivity.