Operations | Monitoring | ITSM | DevOps | Cloud

Monitoring

The latest News and Information on Monitoring for Websites, Applications, APIs, Infrastructure, and other technologies.

What is Chronograf?

InfluxDB is an open-source time-series database, i.e. a database optimized for storing data points collected across an interval of time. Developed by InfluxData, InfluxDB is intended for fast, high-availability storage and retrieval of many different system metrics. The entire InfluxDB project, which is housed at influxdata.com, includes: Yet with all of these tools for collecting and processing time-series data, there's still one step missing—visualizing it. That's where Chronograf comes in.

Distributed Tracing with MuleSoft APIs using OpenTelemetry

Distributed tracing enhances observability by providing detailed insights into the performance, behavior, and dependencies of your distributed system. It empowers you to proactively identify and resolve issues, optimize performance, and deliver a reliable and high-performing application.

Experience This! What is the Importance of Application Experience?

If you have ever worked in a kitchen, you know how tough it is to be short-staffed. Cooks have to work twice as hard and their performance suffers, leaving not-so-happy customers and comped meals for the complainers. It’s similar to how applications operate. Maybe an application is glitching out from poor coding on the backend or bogging from an influx of data coming in. In either case, the end-user application experience suffers.

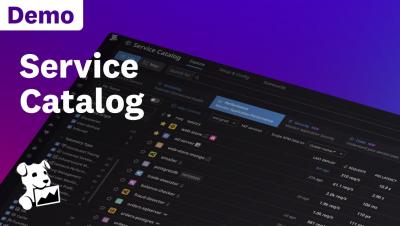
Datadog Service Catalog Demo

See what it’s like to have a central hub for all service knowledge alongside real-time observability data, including ownership, reliability, performance, and security, all in one place. With Service Catalog, you can not only better evaluate your system’s production readiness and adherence to industry best practices at scale with Scorecards, but also better understand the interrelationships between different microservices, or capture the cascading dependencies, between services and teams.

MTTR vs. MTBF vs. MTTF: Understanding Failure Metrics

In the dynamic landscape of software and web applications, failures can have severe consequences, impacting user experience, business continuity, and overall performance. To proactively address these challenges, organizations rely on robust monitoring practices supported by failure metrics. Failure metrics, specifically tailored to software and web application monitoring, provide crucial insights into system health, reliability, and optimization opportunities.

10 Essential Distributed Tracing Best Practices for Microservices

If you are a SaaS provider making an application that deals with, say, a health registry or some personal information of the public, you realize how crucial it is to maintain their confidentiality. It is these situations that demand a previous encryption of data followed by a prompt tracing mechanism that finds out the faults right at the moment or prior to its occurrence. And what better way to keep track of your application than tracing?

Best practices for monitoring static web applications

Static sites are currently a popular solution for many lightweight web applications, such as corpsites, blogs, job listings, and documentation repositories. In static web architecture, pages are generated and pre-rendered at build time from markup files, and usually cached in a content delivery network (CDN) for efficient delivery. This saves teams the effort and cost of server management while enabling fast page load times.

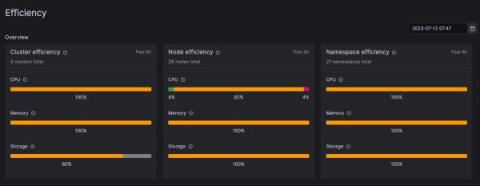
Monitor the past, present, and future of your Kubernetes resource utilization

Greetings, Kubernetes Time Lords! Through a series of recent updates to our multi-purpose Kubernetes Monitoring solution in Grafana Cloud, we’ve made it easier than ever to assess your resource utilization, whether you’re looking at yesterday, today, or tomorrow. All companies that use Kubernetes, regardless of size, should monitor their available resource utilization. If a fleet is under-provisioned, the performance and availability of applications and services are at serious risk.

The Importance of Log Monitoring for Incident Response

In the face of growing security threats and incidents, businesses must prioritize their ability to detect, investigate, and respond effectively. Timely incident response is crucial for maintaining the security and integrity of systems and data. Among the essential tools in the incident response arsenal, log monitoring stands out as a critical component. By closely analyzing logs, organizations gain valuable insights into system events, user activities, and network traffic.