Grey's Academy 301: Intel (OpenVino)
Join Grey Dziuba and Johnny Chen from Intel to discuss Splunk and OpenVino.


The latest News and Information on Log Management, Log Analytics and related technologies.
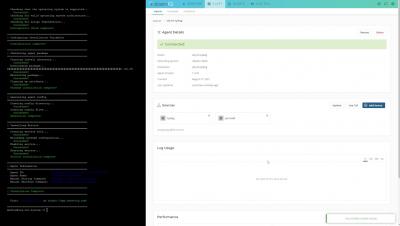
Our log agent is powerful, efficient, and highly adaptable. Now, with OpenTelemetry setting new standards in the observability space, we wanted to incorporate that collaboration into our log agent and offer our users the ability to take advantage of the OpenTelemetry ecosystem. Starting today, you can upgrade the log agents in your observIQ account to the new Open Telemetry-based observIQ log agent with a single click.
Dropped log lines due to out-of-order timestamps can be a thing of the past! Allowing out-of-order writes has been one of the most-requested features for Loki, and we’re happy to announce that in the upcoming v2.4 release, the requirement to have log lines arrive in order by timestamp will be lifted. Simple configuration will allow out-of-order writes for Loki v2.4.
To monitor your Elastic Stack with Elastic Cloud on Kubernetes (ECK), you can deploy Metricbeat and Filebeat to collect metrics and logs and send them to the monitoring cluster, as mentioned in this blog. However, this requires understanding and managing the complexity of Beats configuration and Kubernetes role-based access control (RBAC). Now, in ECK 1.7, the Elasticsearch and Kibana resources have been enhanced to let us specify a reference to a monitoring cluster.
Monitoring, troubleshooting, and debugging your code all require logging. It not only makes the underlying execution of your project more visible and understandable, but it also makes the approach more approachable. Intelligent logging procedures can assist everyone in a company or community to stay on the same page about the project's status and progress.