Operations | Monitoring | ITSM | DevOps | Cloud
Logging
The latest News and Information on Log Management, Log Analytics and related technologies.
Importing your Cloudwatch Metrics into Prometheus
Cloudwatch is the de facto method of consuming logs and metrics from your AWS infrastructure. The problem is, it is not the de facto method of capturing metrics for your applications. This creates two places where observability is stored, and can make it difficult to understand the true state of your system. That’s why it has become common to unify all data into one place, and Prometheus offers an open-source, vendor-agnostic solution to that problem.
A new year with a new look and many more...
Simplified analysis. Enhanced visualizations, alerting capabilities, advanced data forwarding, and more. Great news! We have published a new update with many exciting new features and optimizations.
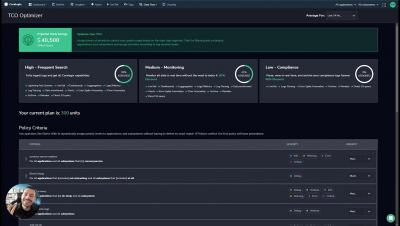
Save 40-70% of Your Observability Costs with Coralogix TCO
Introducing the Cribl Stream Reference Architecture
How to Create a Dashboard in Kibana
Better troubleshooting with a new Cloud Logging plugin for Grafana
You can now use the Cloud Logging datasource plugin to view your logs in Grafana.
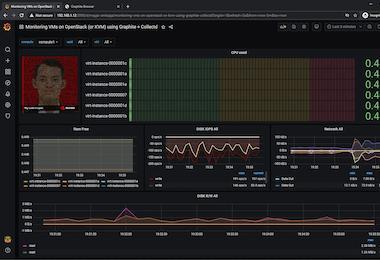
The Best Graphite Dashboard Examples
Graphite provides time-series metrics in an open-source database. With Graphite dashboards, you can see key performance indicators (KPIs) as well as other metrics visually. Dashboards typically display data as graphs, charts, and tables and can be customized to meet the specific needs of an organization. Using dashboards, organizations can monitor and analyze various aspects of their performance, such as system utilization, application performance, and resource utilization, using web interfaces.
What is Syslog and how does it work?
When you’re adding or subtracting fractions, you need to make sure that they have a common denominator, a number that allows you to compare values. In the same way, your IT environment needs a common “language” for your event log data. Your environment consists of various devices running different operating systems, software, and firmware.


