Operations | Monitoring | ITSM | DevOps | Cloud
Latest Videos
Creating Charts in Sematext Cloud
Charts are a valuable tool for monitoring and tracking the performance of your application infrastructure because they provide a clear and concise visual representation of data. This can be especially useful when you have large amounts of data to analyze, or when you need to quickly identify trends or patterns in your data.
Transfer Files from Phone to Laptop without USB #filesharingapp
Find the easiest way to transfer files from a phone to a laptop without a USB? AirDroid Personal offers all the exciting features you need to share unlimited data between your phone and PC/laptop.
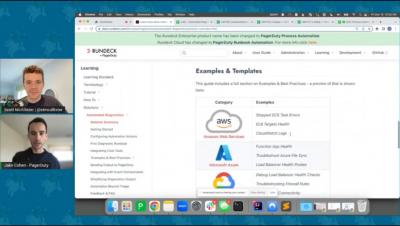
Season's Freezings: Automated Diagnostics with Jake Cohen
Jake Cohen talks to Scott McAllister about automation in PagerDuty and the advancements in Automated Diagnostics.
Datadog on Building an Event Storage System
When Datadog introduced its Log Management product, it required a new event data storage platform, as storing logs and events is a completely different problem from storing metrics, which was the first Datadog product. Over time, Datadog introduced more and more products that needed to store and index multi-kilobyte timeseries “events”, re-using the Event Platform infrastructure from Log Management. The increased use of the Event Platform and the new feature requirements coming from new products started exposing the limitations of the legacy system and the need for a new approach
How to install the Site24x7 APM Insight .NET Core agent in Linux
This video will guide you through the installation of the Site24x7 APM Insight.NET Core agent. With the APM Insight.NET Core agent, you can monitor your web applications built in.NET Core 2.0 and above. You can track HTTP requests, SQL queries, errors, exceptions, web API calls, and remote calls in your ASP.NET Core applications hosted on Windows, Linux, or Mac. Related links The one-line code to include in the Program.cs file: builder.Services.AddSite24x7ApmInsights();
Dashboard Fridays: Sample Grafana Dashboard
This SquaredUp Grafana dashboard surfaces status information from Grafana, giving you a big picture overview across teams and apps – all while allowing you to utilize your existing dashboards and alert rules. Tune in to learn how it was made, the challenges it solves, and our top tips for building it yourself.
Dashboard Fridays: Sample Google Kubernetes Engine Dashboard
This SquaredUp dashboard shows key metrics from any GKE (Google Kubernetes Engine) clusters and node groups, including utilization of resources and health status. Tune in to learn how it was made, the challenges it solves, and our top tips for building it yourself.
Dashboard Fridays: Sample Azure Application Insights Dashboard
This SquaredUp dashboard uses the Azure plugin to surface key performance metrics from Application Insights. Common user experience metrics are all provided out of the box, and we can query, summarize, and analyse the raw logs and traces. Tune in to learn how it was made, the challenges it solves, and our top tips for building it yourself.
Dashboard Fridays: Sample Google Compute Engine Dashboard
This Google Compute Engine dashboard shows key metrics about any GCE instances, managed instance groups, and related resources such as GCE disks. These metrics include utilization of resources and health status. Tune in to learn how it was made, the challenges it solves, and our top tips for building it yourself.


