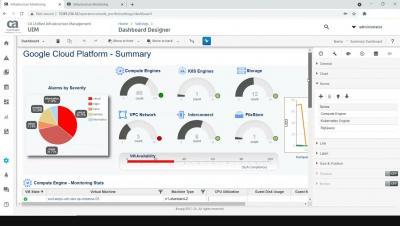
Operations | Monitoring | ITSM | DevOps | Cloud

Pulseway - IT support just got a whole lot smarter

Support teams spend most of their time repeatedly fixing the same issues in the same way. The Pulseway client portal allows you to automate these resolution paths while giving end-users immediate responses to common issues. By reducing the support load, you have more time to focus on proactive, higher-value activities, while users no longer wait in support queues.

How to easily track DORA metrics

With Sleuth, you can instantly and automatically track the four DORA metrics: Change Lead Time, Deploy Frequency, Change Failure Rate, and MTTR. No more, no less. Sleuth tracks them accurately, doesn't attempt to track dubious individual metrics, and doesn't require any manual work. SLEUTH A deploy-based Accelerate Metrics tracker both managers and developers love.

How to Reduce Change Lead Time

The time it takes to get a change into production, also known as Change Lead Time, is an important measure of developer productivity, and one of the four DORA metrics. In Sleuth, you can easily break down Change Lead Time into activities to get insights into potential bottlenecks. SLEUTH A deploy-based Accelerate Metrics tracker both managers and developers love.

Announcing Workflows - Fix k8s issues on the fly

Meet "Workflow" from Komodor, the feature that automates troubleshooting common errors in Kubernetes. Leveraging Komodor’s change intelligence capabilities, Workflow's smart algorithm automatically detects Kubernetes issues and responds with a series of checks that quickly pinpoint its root cause. Not stopping there, Komodor uses the information to provide made-to-measure instruction for remediation, turning troubleshooting into a fast and effortless experience for dev and ops.

Making data accessible with sound, a Grafana Labs Hackathon project by Kostas Pelelis

We learned from a visually impaired astronomer that it was possible to use sonification to understand astronomical spectra. So during a hackathon at Grafana Labs we decided to turn time series into audio, and add sound to our alerting systems too. Kostas Pelelis is a Software Engineer at Grafana Labs living in Greece.

JFrog and Upswift: Bringing IoT Software Updates to DevOps Upswift Acquistion

JFrog has acquired Upswift to bring the world of connected devices into the DevOps pipeline! Managing fleets of devices and edge applications remotely - including over-the-air (OTA) updates, security, monitoring, controlling and more - has quickly become unwieldy for most companies, with growth of connected devices expected to reach 24 billion in 2026. But, most of today’s DevOps solutions are not optimized or built to deliver software updates to distributed edge and IoT environments.

Bootstrapping a multi DC cloud native observability stack by Bram Vogelaar

An introduction to Observability and how to setup a highly available monitoring platform, across multiple data centers. During this talk we investigate how to config a monitoring setup across 2 DCs using Prometheus, Loki, Tempo, Alertmanager and Grafana. Bram Vogelaar spent the first part of his career as a Molecular Biologist, he then moved on to supporting his peers by building tools and platforms for them with a lot of Open Source technologies. He now works as a DevOps Cloud Engineer at The Factory.

Testing with k6 + Grafana: Better together by Nicole van der Hoeven

k6 is one of the newest additions to the Grafana Labs family, but what exactly is it, and what does it have to do with Grafana? In this session, Nicole van der Hoeven will demonstrate how to use k6, how to integrate it with Grafana, and why k6 and Grafana are better together. Nicole van der Hoeven is a Developer Advocate at k6, living in the Netherlands.