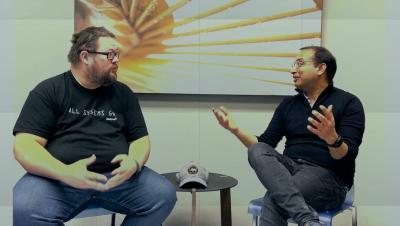
Join Netreo GM, APM Solutions Sanjeev Mittal and Netreo Principal Engineer Dan Gidman for a Fireside Chat detailing the new benefits OpenTelemetry ingestion brings to users of Prefix by Netreo.
Prefix puts the power of OpenTelemetry in the hands of developers, supercharging performance optimization for your entire DevOps team. With unmatched observability across user environments, new technologies, frameworks and architectures, Prefix simplifies every step in code development, app creation and ongoing performance optimization for your apps and your team!
The last few years of the pandemic have shown us that the Internet is an essential service. Companies that were not e-commerce ready or monitoring site performance were left behind. In 2021, smartphone reseller, Swappie, was able to increase revenue by a staggering 42%, focusing on optimizing their Core Web Vitals.
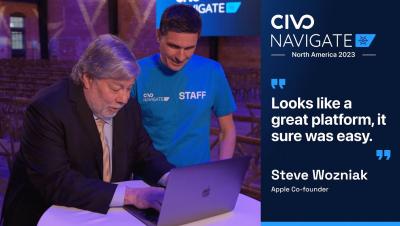
At Civo Navigate NA 2023 we were joined by Co-founder of Apple, Steve Wozniak, as he explored the future of tech and his time at Apple. As the interview ended, Mark Boost, CEO of Civo, showed Steve Wozniak how to launch his first-ever Kubernetes cluster using Civo!
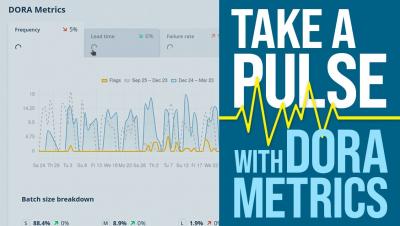
If you're being asked to do more with less on your software engineering team, you need to be able to see at a glance how your team is doing. Are you deploying at a consistent rate? What's your lead time for changes? Where are your bottlenecks? Our CTO, Don Brown, shows how we take a pulse of our performance at Sleuth using DORA metrics.
Software engineering managers: if you make a change to a team process, how do you measure its impact? Did it work, or didn't it? DORA metrics can give you the data to verify your experiment. Here's an example of how we use DORA metrics to improve at Sleuth.
There are more than 12 billion IoT devices globally, and IDC estimates 41 billion by 2025. IoT includes connected smart devices like industrial robots, retail kiosks, security cameras, and maker devices using Raspberry Pi (RPi). Managing IoT into real-world production can be challenging to scale and manage. JFrog Connect is a complete solution for updating, monitoring, managing and troubleshooting Linux-based devices globally.
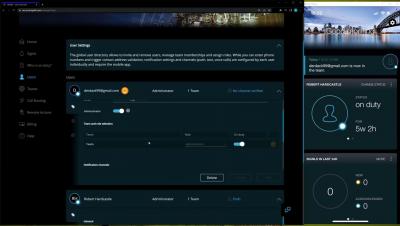
The SIGNL4 customer Journey series walks users through the process's of SIGNL4 from Signup to Alerts to Settings. Todays video focuses on the step for Signup a new Subscription and downloading the Mobile app.