Join our CEO and co-founder Oskari as he sits down with Delivery Hero's Director, Leadership & Managership Development, Micah Lasseter as they discuss the role of tech, AI and nurturing talent.
Check out the Uptime.com chrome-based Transaction Recorder to simplify your synthetic monitoring. Quickly setup checks to monitor your forms, login processes, and payment process simply by mimicking the click actions of your users. For more information on the Transaction check and other Uptime.com features, check out the rest of our video library or view our support documentation linked below.
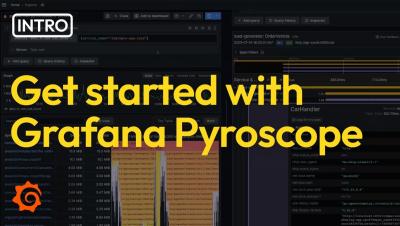
Grafana Pyroscope is a multi-tenant continuous profiling aggregation system, aligning its architectural design with Grafana Mimir, Grafana Loki, and Grafana Tempo. It facilitates the ingestion, storage, and querying of profiles and seamlessly integrates with Grafana, enabling a cohesive correlation of profiling data with existing metrics, logs, and traces.
No matter what you’re trying to achieve – from getting IT costs in line to minimizing vulnerabilities to improving service delivery – knowing what you have will always be step one. See why accurate and actionable asset insights are the foundation for just about everything. Asset visibility makes it all possible. Manage – Secure – Service – Save Your roadmap to actionable asset data. A step-by-step guide to building out a big-picture view of your IT estate and turning it into valuable insights.
"CFEngine: The Agent Is In" is our monthly webinar series, where we show new features, teach best practices, and keep the community informed about everything CFEngine.
Welcome to the StatusCast Demo Video – Your Ultimate Guide to Seamless Status Communication! 🚀 About StatusCast: StatusCast is a cutting-edge platform designed to revolutionize the way you communicate service status and incidents to your users. Whether you're a tech company, SaaS provider, or any organization relying on online services, StatusCast ensures that you keep your users informed, engaged, and satisfied.
In this video, you'll see a deep dive demo into the experimental TraceQL metrics feature in Grafana Tempo 2.4. We'll show you how to use TraceQL metrics to do both root cause and impact analysis as well as other use cases, such as determining how many database queries are downstream of your application. ☁️ Grafana Cloud is the easiest way to get started with metrics, logs, traces, dashboards, and more. We have a generous forever-free tier and plans for every use case.
To help optimize your Kubernetes resources (and the costs associated with them), Kubernetes Monitoring in Grafana Cloud offers features to manage and monitor Kubernetes resources and, in return, your observability bills. In this video, we'll show you how Kubernetes Monitoring helps you: ☁️ Grafana Cloud is the easiest way to get started with metrics, logs, traces, dashboards, and more. We have a generous forever-free tier and plans for every use case.