Operations | Monitoring | ITSM | DevOps | Cloud

The Place Where Modern Operations & Technology Come Together


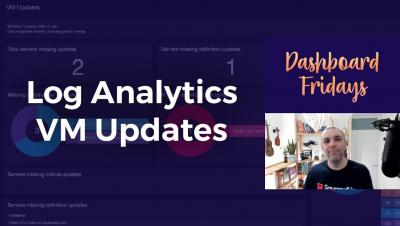
Dashboard Fridays: Log Analytics VM Updates
Join Adam Kinniburgh in this latest Dashboard Fridays episode, in which he showcases this VM Updates dashboard, built with the WebAPI tile for the CE and SCOM editions. Since there is a native connection to the Log Analytics workspace in the Azure edition, here it is created using the native Logs tile. This dashboard surfaces key metric data for Virtual Machines, regardless of where the servers are hosted.
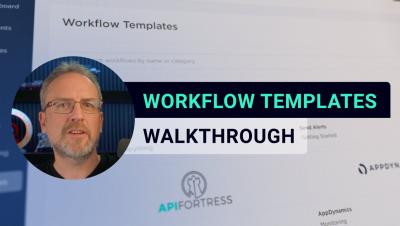
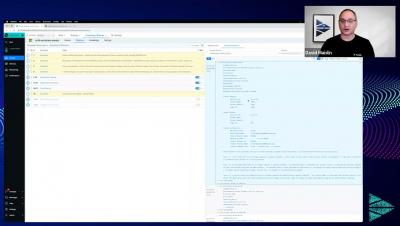
Workflow Templates - xMatters Support
xMatters includes templates for workflows between xMatters and third-party applications that you can install in your deployment. Many of the available templates offer a low-code solution, allowing you to install an integration and start setting up your automation immediately.

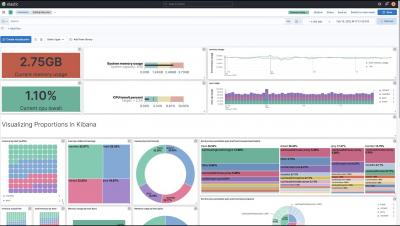
8 ways to visualize proportions in Kibana
Learn about 8 ways to visualize proportions: waffles, treemaps, donuts, pies, bars, mosaics, multi-dimensional pies (sunburst), and multi-dimensional treemaps.

Top 12 Kubernetes Risks
What’s putting your K8s workloads at risk? You probably didn’t immediately think of memory and CPU resources—yet, these pose significant threats to cost and performance in your public cloud Kubernetes and OpenShift deployments. Learn about the top 12 K8s risks and how you can visualize the spread of risk in your containers deployment. You'll also hear a methodology for drilling down to individual misconfigurations and resolving them.
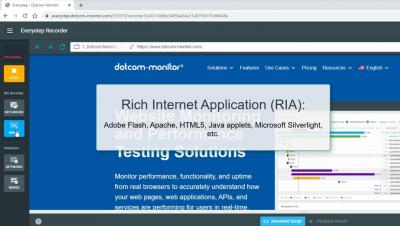
EveryStep Web Recorder: Introduction
This tutorial for the EveryStep Web Recorder will show you how to create basic monitoring scripts for web applications, server uptime tasks, and load testing.

How APA-Tech Uses Observability to Make Sense of Tons of Monitoring Data With Georg Höllebauer
APA-Tech is a managed service provider in Austria, responsible for all IT services within the Austrian Press Agency - Austria's national and largest press agency - as well as other customers. In this video, Georg Höllebauer, Enterprise Metrics Architect at APA-Tech, explains how he and his team use topology-powered observability to make sense of all the monitoring data they were collecting and get a better overall picture of their customer's IT environment.