Check out the latest improvements to Mattermost's plugin infrastructure, including platform-sensitive binary downloads and improved notifications for crashed plugins.
Business metrics are notoriously hard to monitor because of their unique context and volatile nature. Anodot’s Business Monitoring platform uses machine learning to constantly analyze and correlate every business parameter, providing real-time alerts and forecasts in their context. This is machine learning packaged in a turn-key solution – no data science experience needed.
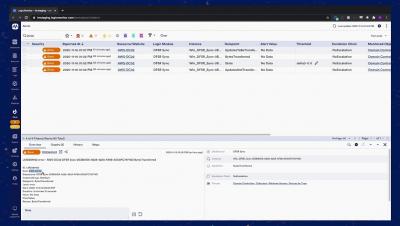
In this quick demo, Sales Engineer, Patrick Carpenter, walks through how LM Logs can significantly help to resolve DFS replication issues quickly. Rather than sifting though endless logs manually, LM Logs surfaces log anomalies automatically saving time and resources.
Most IT professionals aren’t using their log data efficiently. The overwhelming volume of log data is unmanageable, and the information is difficult to decipher. LogicMonitor sees logs differently. LM Logs analyzes logs to ensure IT Operations teams have the right logs at their fingertips and offers a unique and unified approach to log analysis centered on algorithmic root-cause analysis.
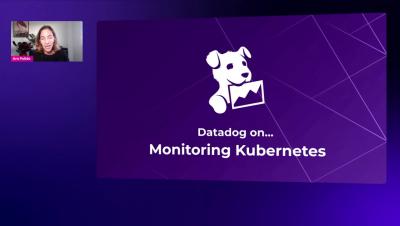
With many blog posts published and talks given on the topic, it’s no secret that Datadog is running Kubernetes at scale. We currently run dozens of clusters, some of them with thousands of nodes. Additionally, we have clusters running in multiple clouds. How are we monitoring all of that, ensuring we can scale up quickly and safely?
This video takes you through the brief set up of the modern incident management and response features in Jira Service Management, powered by Opsgenie. We cover building a team, creating an on-call schedule, and escalating incidents.
This video takes a brief tour of the incident management capabilities in Jira Service Management, powered by Opsgenie. Service desk agents can view the on-call schedule, all open incidents and major incidents, and escalate issues for a rapid resolution.