Operations | Monitoring | ITSM | DevOps | Cloud

Latest News

451 Research and IDC Call Out OpsRamp's Innovations for Service-Centric AIOps and Hybrid Cloud Management

The second quarter of 2019 started with a bang for OpsRamp, with recognition from two independent analyst firms, 451 Research and IDC. Three recent analyst reports highlighted OpsRamp’s modern digital and IT operations management platform for dynamic performance insights and maximum visibility.

From SRE to QE - Full Visibility for the Modern Application in both Production and Development

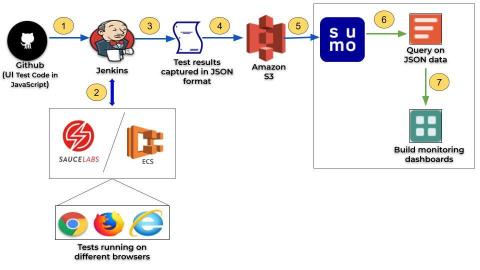
Site reliability engineers (SREs) rely on monitoring and analytics tools like Sumo Logic to guarantee uptime and performance of their applications and various components or services in production. The ability to visually monitor, automatically generate alerts and efficiently troubleshoot an issue in real time has become table stakes for any modern SRE team.

Monitoring Kubernetes + Docker, part 3: Sensu + Prometheus

In part 1 of this series, we discuss the rise of Kubernetes and Docker for containerization and container orchestration. I also shared some of the challenges these new technologies present and what sources of data we use to monitor Kubernetes. Part 2 dives into collecting Kubernetes data with Prometheus, plus the pros and cons of that approach. As promised in the conclusion of that post, I’ll address those cons — showing how Sensu and Prometheus form a complementary solution.

How to Serverless Locally: The Serverless Dev Workflow Challenge

One of the biggest challenges when adopting serverless today is mastering the developer workflow. “How do I develop locally?”, “How should I test?”, “Should I mock AWS services?”. These are common serverless questions, and the answers out there have been unsatisfying. Until now.

Next Time You Configure or Update Your Network Interfaces Use This Checklist

Interfaces, commonly known as ports, are a vital component of any network. Need to connect two pieces of equipment? It could be as easy as plugging in cables—but then you’re using out of the box configurations that don’t follow best practices and are inherently insecure.

How SevOne Is Live Streaming Grafana Data Sources

SevOne, a 14-year-old company in the network monitoring space, started using Grafana for self-monitoring last year because there weren’t many frontend engineers in the organization at the time. “We fell in love with it,” SevOne Tech Lead Sean Lafferty said during his GrafanaCon talk about how the company live streams Grafana data sources.

Introducing the Sentry Integration Platform

Since Sentry started, people have been asking us to build integrations for their favorite services. We get it — developer tools are always better when they work together. As Socrates said, teamwork makes the dream work. We like to help out, and that’s why today we’re launching the Sentry Integration Platform. Now you have the power to build the kind of integrations you want to see in Sentry. No need to wait around for us to do it.