Operations | Monitoring | ITSM | DevOps | Cloud

Latest News

Open Source Automation Tools: The Most Popular Options + How to Choose

When looking at the broad landscape of IT automation tools, you’ll find dozens of tools that seem like viable solutions to your automation needs. Almost all of those tools can be broken down into two categories: Open source automation tools and commercial automation tools. (Open source automation tools with a commercial offering are still considered open source, even if the commercial version has a price tag.)

Monitoring Pi-hole using Pi-hole Exporter and OpenTelemetry: A Comprehensive Guide

Pi-hole is a fantastic open-source DNS-based ad blocker that enhances your online experience by blocking unwanted ads and trackers network-wide. Monitoring the performance and status of your Pi-hole setup is essential to ensure its effectiveness. Next, we'll explore how to use a Prometheus exporter to expose metrics from Pi-hole and have the OpenTelemetry collector scrape the metrics and send them to Splunk Observability Cloud.

Open source log monitoring: The concise guide to Grafana Loki

Five years ago today, Grafana Loki was introduced to the world on the KubeconNA 2018 stage when David Kaltschmidt, now a Senior Director of Engineering at Grafana Labs, clicked the button to make the Loki repo public live in front of the sold-out crowd. At the time, Loki was a prototype: We bolted together Grafana as a UI, Cortex internals, and Prometheus labels to find out if there was a need for a new open source tool to manage logs.

Introducing Canonical's new open source support portal

Amplifying the global impact of open source is at the heart of Canonical’s mission. Support is a crucial part of this exciting journey, especially when it comes to helping enterprises, institutions and communities around the world solve real-world problems through their IT infrastructure and applications. Working with thousands of global customers in a variety of use cases, our support team delivers fixes on everything open source, both Canonical-maintained projects and others.

VictoriaMetrics Enterprise, the World's Fastest Open-Source-Based Monitoring: Try It for Free

We’re happy to announce that we now offer a free trial of our VictoriaMetrics Enterprise solution! Designed to help solve an organisation’s monitoring and observability set ups, no matter the scale, VictoriaMetrics Enterprise provides reliable, secure and cost-efficient monitoring. The free trial of VictoriaMetrics Enterprise is perfect for organisations with large data loads, for whom cost-efficient monitoring is mission-critical.

'The Story of Grafana' documentary: Celebrating OSS, community, and innovation

On Dec. 5, 2013, Torkel Ödegaard made the first commit in GitHub for a personal project that would become Grafana. “It’s hard to believe it’s been 10 years since Torkel launched Grafana, growing from a small man with a big dream to becoming the most popular data visualization software in the world,” says Grafana Labs co-founder and CEO Raj Dutt. “The Story of Grafana” chronicles that meteoric journey.

Spring Boot Monitoring with Open-Source Tools

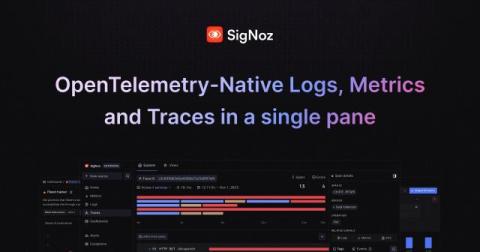
Spring Boot Monitoring aims to provide real-time insights into various aspects of a Spring Boot application. Spring Boot provides useful libraries like the Spring Boot Actuator and Micrometer to aid in monitoring. But in order to set up effective monitoring, you need to use a tool where you can send the monitoring data for storage and visualization. In this tutorial, we cover: In this tutorial, you will learn how to monitor a Spring Boot application with SigNoz and OpenTelemetry.