Operations | Monitoring | ITSM | DevOps | Cloud

Latest Blogs

How to Deploy the Splunk OpenTelemetry Collector to Gather Kubernetes Metrics

With Kubernetes emerging as a strong choice for container orchestration for many organizations, monitoring in Kubernetes environments is essential to application performance. Kubernetes allows developers to develop applications using distributed microservices introducing new challenges not present with traditional monolithic environments. Understanding your microservices environment requires understanding how requests traverse between different layers of the stack and across multiple services.

Plugin Spotlight: Exec & Execd

Telegraf comes included with over 200+ input plugins that collect metrics and events from a comprehensive list of sources. While these plugins cover a large number of use cases, Telegraf provides another mechanism to give users the power to meet nearly any use case: the Exec and Execd input plugins. These plugins allow users to collect metrics and events from custom commands and sources determined by the user.

TL;DR InfluxDB Tech Tips - Visualizing Uptime with Flux deadman() Function in InfluxDB Dashboards

A common DevOps use case involves alerting when hosts stop reporting metrics, aka a deadman alert. This can be done using the monitor.deadman() Flux function. One can easily create a deadman (or threshold) check in the InfluxDB UI Alerts section or craft a custom task to alert as well. Check out InfluxDB’s Checks and Notifications system post for more details. It’s also possible to use the monitor.deadman() function directly in a dashboard cell.

Deploy to Any Kubernetes Cluster Type with New Tanzu Mission Control Catalog Feature

Deploying packages to distributed Kubernetes clusters is time-consuming. Those in charge of provisioning and preparing infrastructure for application teams know the pain of preparing clusters for production. Provisioning is only the start of a laborious process required to prepare a cluster. Once the cluster is up and running, deploying tools for things like monitoring and security is a DevOps imperative.

How To Uncover Personalization Opportunities Using Data Analytics

There's a lot of information and details which you can find about your website with the use of data analytics. Your website is like the virtual equivalent of a physical store. People come and go. Some of them buy, while some just look around. If you have a surveillance camera in your store, you'd have a record of who came in, what they did, and with the help of the receipts, what they bought.
Sponsored Post

Leveraging Your Integration Infrastructure

The investment your organization has made in integration infrastructure (i2) over the years was necessary as the organization and the IT infrastructure grew, but it has likely been considered a necessary evil by senior management. However now that investment can be leveraged in two important new ways.

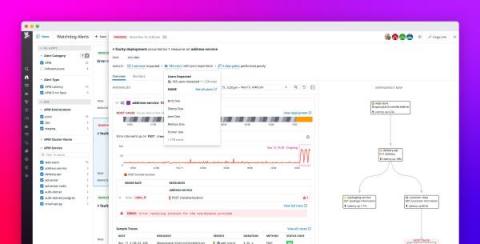
Understand the scope of user impact with Watchdog Impact Analysis

Watchdog is Datadog’s machine learning and AI engine, which leverages algorithms like anomaly detection to automatically surface performance issues in your infrastructure and applications. Without any manual setup or configuration, Watchdog generates a feed of Alerts—on anomalies such as latency spikes, elevated error rates, and network issues in cloud providers—to help you reduce your mean time to detection.

Monitor your HCP Vault cluster with Datadog

HashiCorp Cloud Platform (HCP) provides fully managed versions of some of HashiCorp’s most popular offerings, including Vault. With Vault, users have a centralized way to secure, store, and manage access to secrets across distributed systems. HCP Vault handles the day-to-day cluster maintenance, patches, and overall system security, making it easy to deploy a cluster without needing to host or manage your own infrastructure.