Operations | Monitoring | ITSM | DevOps | Cloud

Sponsored Post

Why AIX Monitoring Matters | Reasons, Obstacles, Solutions

AIX monitoring is essential for ensuring enterprise IT reliability, performance, and security. Traditional solutions often lack the depth needed for complex AIX environments, making specialized tools crucial for tracking performance and preventing downtime. As the need for real-time, automated monitoring grows, advanced solutions like NiCE AIX Management Pack integrate with Microsoft SCOM to enhance visibility and system optimization. By leveraging dedicated AIX monitoring, businesses can improve uptime, security, and efficiency, ensuring long-term infrastructure success.

Understanding the Apache access log: how to view, locate, and analyze

Log files are invaluable tools for developers and system administrators when it comes to debugging issues within web applications. They often serve as the primary source of information when troubleshooting website malfunctions. Among these logs, the Apache HTTP server’s access log stands out as a key resource for debugging applications and gaining insights into visitor activity.

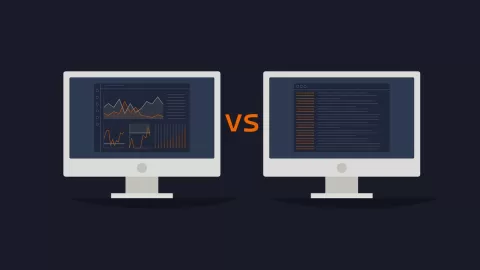
Logging vs. Metrics

When discussing observability, the “big 3” - logs, metrics, and traces, always get mentioned. But for some, more data doesn’t always mean better. Our lead engineer, JJ, had some advice to share about how logs may not be necessary for everyone. Simplifying your observability stack isn’t difficult - you just need to be intentional with implementation. Check out more MetricFire blog posts below, and our hosted Graphite service! Get a free trial and start using MetricFire now!

How APM and synthetic monitoring work together for better performance

Imagine this: A customer tries to log in to your app, but the page takes too long to load. Frustrated, they leave. Meanwhile, your IT team has no clue there was an issue—until complaints start pouring in. Sound familiar? Performance lags are the new downtime. Lags are not just an inconvenience—they lead to lost revenue and frustrated users. To prevent this, organizations turn to application performance monitoring (APM) and synthetic monitoring to maintain peak application performance.

OpenTelemetry UI: The Ultimate Guide for Developers

If you’ve ever struggled with understanding distributed traces, managing metrics, or debugging complex applications, OpenTelemetry is your best friend. But what about the OpenTelemetry UI? How do you visualize and interact with all that telemetry data? In this guide, we’ll explore the best ways to use OpenTelemetry’s UI options, from setting up a proper observability stack to choosing the right front-end visualization tools.

Integrating OpenTelemetry with Grafana for Better Observability

Modern application observability is essential for ensuring system performance, diagnosing issues, and optimizing user experiences. OpenTelemetry (Otel) and Grafana serve as two key components in achieving end-to-end visibility. While OpenTelemetry focuses on instrumenting applications to collect telemetry data, Grafana specializes in visualizing this data, making it actionable and insightful.

An In-Depth Guide to Java Performance Monitoring for SREs

If you've ever had a Java application slow down in production and struggled to pinpoint the cause, you know the pain of performance issues. Java is a powerful, high-level language, but it doesn’t come without challenges—especially when it comes to resource management, garbage collection, and thread handling. This guide will take you through everything you need to know about Java performance monitoring, from key metrics to tools and best practices.

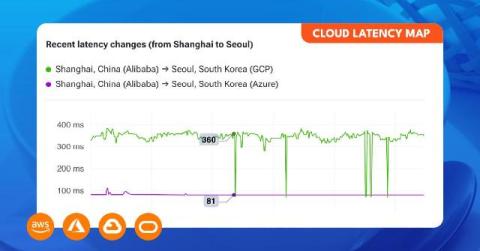
CLM Chowder: Digging Into the Cloud Latency of Azure, Google Cloud, and OCI

CLM Chowder is a new series which highlights notable observations of cloud connectivity surfaced by Kentik’s Cloud Latency Map. In this edition, we look at measurements from Alibaba (China), latency swings from South Africa, and a temporary latency jump from Marseilles to Asia.