Operations | Monitoring | ITSM | DevOps | Cloud

The latest News and Information on Monitoring for Websites, Applications, APIs, Infrastructure, and other technologies.

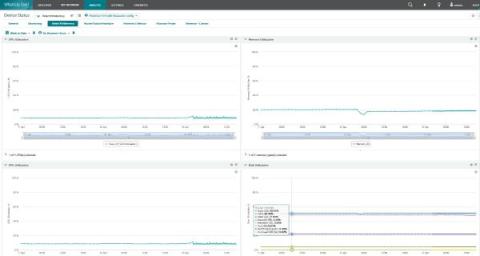
Monitoring the Health Status of Progress Flowmon Appliances with IT Infrastructure Monitoring Tools

Progress Flowmon is a core network monitoring and security tool. Confirming if it is up and running can mean the difference between responding to a data breach or overlooking such a critical event. Like any other critical system, it is a good practice to include the monitoring of Flowmon uptime, resource consumption and health in an IT infrastructure monitoring (ITIM) dashboard, such as Progress WhatsUp Gold.

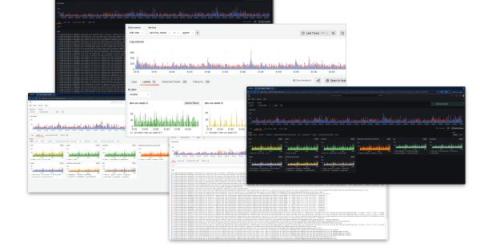
Introducing an OpenTelemetry Collector distribution with built-in Prometheus pipelines: Grafana Alloy

In the opening keynote of GrafanaCON 2024, we announced our newest OSS project: Grafana Alloy, our open source distribution of the OpenTelemetry Collector. Alloy is a telemetry collector that is 100% OTLP compatible and offers native pipelines for OpenTelemetry and Prometheus telemetry formats, supporting metrics, logs, traces, and profiles. Some of you may be thinking: Wait, another collector?

Find your logs data with Explore Logs: No LogQL required!

We are thrilled to announce the preview of Explore Logs, a new way to browse your logs without writing LogQL. In this post, we’ll cover why we built Explore Logs and we’ll dive deeper into some of its features, including at-a-glance breakdowns by label, detected fields, and our new pattern detection. At the end, we’ll tell you how you can try Explore Logs for yourself today. But let’s start from the beginning — with good old LogQL.

Loki 3.0 release: Bloom filters, native OpenTelemetry support, and more!

Welcome to the next chapter of Grafana Loki! After five years of dedicated development, countless hours of refining, and the support of an incredible community, we are thrilled to announce that Grafana Loki 3.0 is now generally available. The journey from 2.0 to 3.0 saw a lot of impressive changes to Loki. Loki is now more performant, and it’s capable of handling larger scales — all while remaining true to its roots of efficiency and simplicity.

Grafana 11 release: The latest in visualizations, Scenes-powered dashboards, simple access controls, and more

At the opening keynote of GrafanaCON 2024, attendees in Amsterdam got a sneak peek at some of the latest features in Grafana 11, which is now available in preview. Grafana: download now! For those of you who couldn’t score a ticket to the sold-out event, don’t worry — we have a roundup of all the latest updates to visualizations that make it easier than ever to create beautiful dashboards in Grafana.

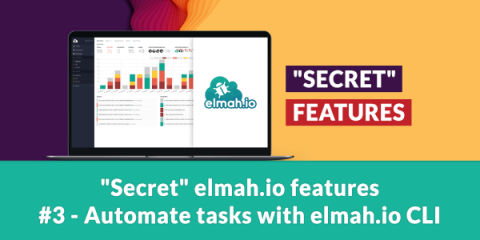
"Secret" elmah.io features #3 - Automate tasks with elmah.io CLI

In this third post in the series of "secret" elmah.io features, I want to introduce you to the elmah.io Command Line Interface (CLI). While you probably spend most of your elmah.io-related time inside the UI, the CLI offers some interesting possibilities not available through the web app. In this post, I'll show what I believe are the two most usable and helpful features of the elmah.io CLI. There are a lot of sub-commands so feel free to play around with it.

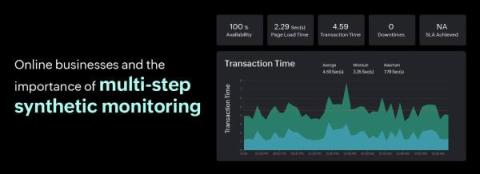
How can multi-step synthetic transaction monitoring help your online business?

Multi-step synthetic transactions, also known as multi-step transactions or multi-step scripts, are automated tests that simulate complex user interactions with a website or web application. Unlike a single-step transaction (like page load), multi-step transactions involve a series of sequential steps or workflows that mimic real-world user journeys.

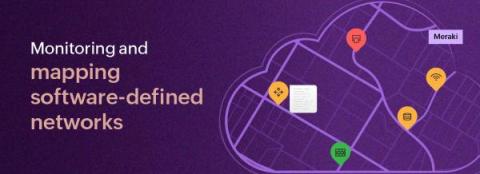
Simplified device health monitoring and mapping for software-defined networks

Are you juggling too many different types of network monitoring dashboards at once? If you're using software-defined networks (SDNs) and also managing traditional networks, it can be quite challenging to monitor them both at the same time since you need to remember which tool is responsible for monitoring which network and keep switching between them. Doing this can be a real hassle, but worry not!