Operations | Monitoring | ITSM | DevOps | Cloud

The latest News and Information on Monitoring for Websites, Applications, APIs, Infrastructure, and other technologies.

Curated dashboards in Honeybadger

Earlier this year, we introduced a new logging and performance monitoring tool, Honeybadger Insights. You can finally send your logs, application events, and telemetry data to Honeybadger! Once you do, you can query your logs and events to diagnose performance issues, perform root-cause analyses, and create beautiful charts and dashboards to see what's happening in real time.

Mastering Linux Logging with ELK: A Step-by-Step Guide

The ELK (Elasticsearch, Logstash, and Kibana) stack is a centralized logging solution that provides users with comprehensive log searches in a single location. The extensive features and varying uses that the solution offers have led to it becoming one of the most popular tools currently available.

Beyond Default Settings: Customized Monitoring with Progress WhatsUp Gold

A monitoring solution cannot monitor all potential failure points directly out of the box, which is why being able to customize your monitoring solution is pivotal. Network availability and performance are crucial for your company’s day-to-day operations. Customers, employees, executives and business partners rely on easier access to your applications, services and data.

How EchoStar Streamlines Hybrid Cloud Management

It takes a complex IT infrastructure of on-premises and multi-cloud environments to support a satellite communications business like EchoStar’s that serves corporate and government clients around the world. For customers, these services are mission-critical so keeping services operational is vital for the service provider. But EchoStar had a problem. It was trying to manage this complex IT infrastructure with eight different legacy monitoring tools running across 75 different internal servers.

Apache Superset and InfluxDB Cloud 3.0

In this tutorial, we’ll learn how to build dashboards using Apache Superset and data from InfluxDB Cloud 3.0. This guide will provide practical steps and insights to integrate these powerful tools, helping you visualize your time series data with ease and precision. Whether you are monitoring IoT devices, applications, or infrastructure, you’ll find valuable tips on leveraging Superset and InfluxDB Cloud to enhance your data analytics capabilities.

Introducing Raygun AI Error Resolution for Aspire

Last month, we rolled out Raygun4Aspire, our Crash Reporting client for.NET Aspire applications. That release included a free, lightweight version of the full Raygun web app that runs locally. After the successful launch of our recent AI Error Resolution feature for Crash Reporting, we knew that we had to bring this feature into the Aspire local development experience. Today, we’re thrilled to announce that AI Error Resolution for Raygun4Aspire is now available for all Aspire app developers!

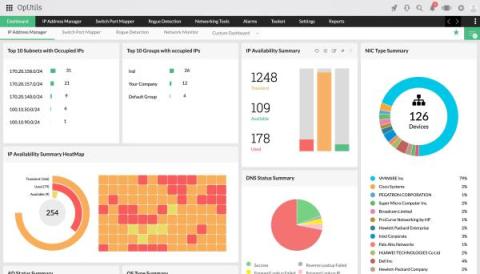
Visibility made simple with OpUtils network IP scanner

OpUtils' network IP scanner empowers network administrators to seamlessly discover the entire network IPs spread across various subnets and supernets and manage them—all from a single console. This allows the administrators to have a single point of control over the entire IP infrastructure, map IPs to the corresponding devices and switch ports, and ensure network security by detecting and restricting access to rogue devices.
Sponsored Post

How unified is your bandwidth monitoring: An ultimate checklist to choosing the right tool

The IT technologies are evolving and challenging every network's agility with its powerful capabilities. Is your monitoring tool competitive enough to handle this radical change? Learn more about how to choose only the robust one.