Aiven for OpenSearch updated to version 2.11.1
Aiven for Opensearch® is running OpenSearch® 2.11.1, bringing new AI capabilities, visual overhauls, and much more. Check out what's new and upgrade today.


Hello again, folks! It sure has been a while. For those of you who know me, you may remember I used to work at SquaredUp as a tech evangelist until a couple of years ago. Then some things happened, and I left in pursuit of something else. However, life has come full circle after about 2 years and boy am I glad to be back!
Welcome to Part 2 of the “Concise guide to Loki,” a multi-part series where I cover some of the most important topics around our favorite logging database: Grafana Loki. As I reflect on the fifth anniversary of Loki, it felt like a good opportunity to summarize some of the important parts of how it works, how it’s built, how to run it, etc. And as the name of the series suggests, I’m doing it as concisely as I can.
In this post, Doug Madory reviews the highlights of his wide-ranging internet analysis from the past year, which included covering the state of BGP (both routing leaks and progress in RPKI), submarine cables (both cuts and another historic activation), major outages, and how geopolitics has shaped the internet in 2023.
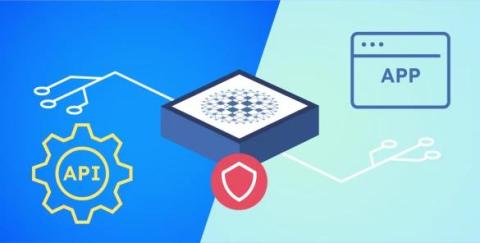
Every day, organizations face external threats as a consequence of exposing their services over the internet. An estimated 2,200+ attacks occur in a 24-hour period—or one attack every 39 seconds. Add the fact that an average data breach (one of many potential consequences of poor security) costs companies $4.45 million, and the need for strong security is impossible to ignore. Web application and API security is key to protecting your infrastructure, data, and users.
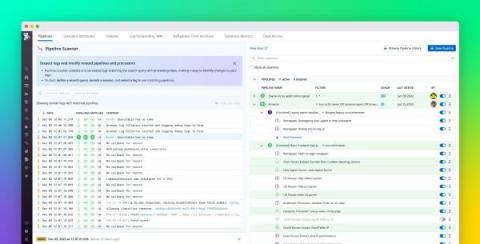
Large-scale organizations typically collect and manage millions of logs a day from various services. Within these orgs, many different teams may set up processing pipelines to modify and enrich logs for security monitoring, compliance audits, and DevOps. Datadog Log Pipeline let you ingest logs from your entire stack, parse and enrich them with contextual information, add tags for usage attribution, generate metrics, and quickly identify log anomalies.