Operations | Monitoring | ITSM | DevOps | Cloud

The latest News and Information on Monitoring for Websites, Applications, APIs, Infrastructure, and other technologies.

Extended retention for custom and Prometheus metrics in Cloud Monitoring

Metrics help you understand how your business and applications are performing. Longer metric retention enables quarter-over-quarter or year-over-year analysis and reporting, forecasting seasonal trends, retention for compliance, and much more. We recently announced the general availability (GA) of extended metric retention for custom and Prometheus metrics in Cloud Monitoring, increasing retention from 6 weeks to 24 months. Extended retention for custom and Prometheus metrics is enabled by default.

Azure MP part 2: Configuring monitoring

This is part two of our journey towards monitoring Azure resources with SCOM, using the Azure Management pack. In Part 1: Installation, we finished installing the Management Pack and managed to connect one of our subscriptions where the resources we want to monitor are. Now, let’s move on to configuring the monitoring for actual resources or services.

Monitoring your own infrastructure with open-source Graphite and Grafana

An infrastructure, especially if it is scalable, can become extremely complex to visualize and observe. If something goes wrong, it would be difficult to fully understand the problem without a great data monitoring strategy. Information related to CPU, RAM, and statistics about SSH or HTTP servers are critical to understanding the performance of your web-application.

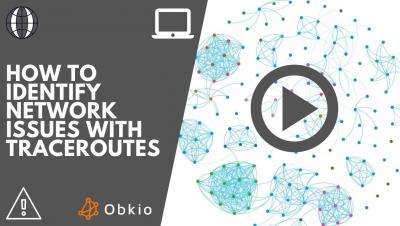
How To Identify Network Issues with Traceroutes | Obkio

When looking at a Traceroute, there's usually two important values for each hop or router: Latency Packet Loss Latency: Refers to the time difference between the time when a packet was sent and when a response was received. The latency between two hops can be affected by a number of things such as: To qualify the latency in a traceroute as good or bad, you should analyze historical traceroutes.

Designing a flexible non-SQl query language without reinventing the wheel

There are tons of query languages. Yet, another query language was invented: the StackState Query Language, or STQL for short. Perhaps this raises some questions. Such as: Why did we not choose to implement SQL? Did we reinvent the wheel? How did we balance the complexity of the language against the time to implement the language? What's the learning curve of this new language? Let me share with you our novel approach.

5 Reasons to Leverage Ping Monitoring Software to Manage Your Device Network

Managing a device network comes with a host of unique challenges covering everything from security to speed. Some of these challenges can be made easier through the use of ping monitoring service or software. Ping monitoring is the act of pinging a device (assessing the time taken for ICMP protocol packets to be delivered to the target host and returned) regularly. If there's no response - or a later response than expected - you get an alert. This time is usually very fast, measured in milliseconds.

MLOps - Logs, Metrics and Traces to improve your Machine Learning Systems

Once you’ve reached the point where you want to deploy your machine learning models to production, you will eventually need to monitor operations and performance. You might also want to receive alerts in case of any unexpected behavior or inconsistencies with your model or your data quality. This is where you most likely start learning about various aspects of Machine Learning Operations (MLOps).