SolarWinds IT Pro Day Survey Finds IT Pros Gained Confidence, New Skills Amidst Pandemic
Annual survey reveals organizations must rethink traditional IT strategy to succeed in new normal.


The latest News and Information on Monitoring for Websites, Applications, APIs, Infrastructure, and other technologies.
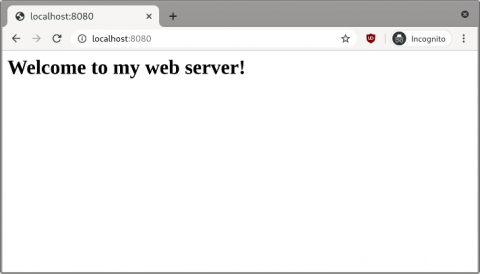
When you're deciding on a technology to use for your project, it helps to have a broad understanding of your options. You may be tempted to build a web service in Go for performance reasons - but what would that code actually look like? How would it compare to languages like Ruby or JS? In this article, Ayooluwa Isaiah gives us a guided tour through the building blocks of go web services so you'll be well-informed.
For many freelancers and small business owners, moving from consulting or freelance development work to operating a SaaS product is the Holy Grail. That makes sense: running a SaaS scales better and makes for a stable income. While there’s no guaranteed path to success, here’s what we learned taking AppSignal from a “20% time side-project” to a business serving thousands of developers around the globe. This article isn’t a blueprint.
Grafana is the de facto open source tool for visualizing metrics. Grafana supports many different backends for data sources and handles each one slightly differently. This blog post is geared towards helping convert Grafana dashboards from using the Graphite backend to using Elasticsearch as a metrics datasource. There are many similarities between how to use both as datasources and how to plot graphs around them, but there are also many differences that need to be accounted for.
Get the most out of PRTG and Flowmon by bringing them under one GUI and allowing their complementary functionalities to work together. Until recently, infrastructure and network monitoring were seen as rivals, but today they are rather viewed as complementary technologies. Seek proof with Gartner - they used to be pitted against each other in the Magic Quadrant, but that has now been replaced by the Market Guide, which explains the differences and strong points but does not compare.
Developer teams shipping software frequently are in a constant state of change. Understanding the state of their code at a given point of time is sometimes clear as mud. The Sentry | Sleuth integration is focused on helping developers automate the annoyances of deploying software, tracking the health of a release, and providing clarity on how to resolve critical code issues.
In our last post on Catchpoint’s 2020 CIO New Normal Survey we talked about how COVID-19 is driving a “reverse industrial revolution” that is fueling a mass exodus from America’s biggest (and most expensive) cities. This week, we focus on a more pragmatic set of findings: the IT lessons that we can learn from those American enterprises that have fared the best during the COVID-19 pandemic.
As a Customer Advocate, I talk to a lot of prospective Honeycomb users who want to understand how observability fits into their existing Site Reliability Engineering (SRE) practice. While I have enough of a familiarity with the discipline to get myself into trouble, I wanted to learn more about what SREs do in their day-to-day work so that I’d be better able to help them determine if Honeycomb is a good fit for their needs.
Google Cloud is growing marketplace traction with enterprise customers as an innovative, service-rich option for multi-cloud environments. The public cloud platform, known to be a developer’s favorite, has solutions by industry and comprehensive offerings in artificial intelligence, analytics, DevOps and high-performance computing among others. Today, OpsRamp announced a partnership with Google to bring hybrid discovery, monitoring, and automation to Google Cloud customers and partners.