Operations | Monitoring | ITSM | DevOps | Cloud

The latest News and Information on Monitoring for Websites, Applications, APIs, Infrastructure, and other technologies.

Introducing DX Unified Infrastructure Management

Today, we are launching the newest feature of Broadcom’s Enterprise Software Academy: DX Unified Infrastructure Management (DX UIM) resource pages. DX UIM is redefining infrastructure management with full-stack observability, an open architecture, modern admin and operator consoles, and zero-touch configuration.

Do it Yourself: Generic REST API-Based Monitoring

DX Unified Infrastructure Management (DX UIM) has more than 150 monitoring probes, which enables IT administrators to monitor everything from traditional mainframe servers to modern hybrid clouds running on a wide range of platforms and operating systems. Traditionally, a separate probe has been required to monitor each specific technology. That’s because the interface that retrieved monitoring metrics was either proprietary or technology specific.

Monitoring Cohesity with DX Unified Infrastructure Management

The Cohesity Data Platform consolidates backups, file shares, object stores, and data on a single web-scale data management platform. As a result, this platform helps reduce data sprawl and mass data fragmentation. The Cohesity platform allows teams to make their backup and unstructured data more productive for a range of efforts, including rapid app development, compliance, security, and analytics.

Full-Stack Infrastructure Observability with DX Unified Infrastructure Management

The IT infrastructure landscape has seen tremendous changes over last few years due to evolving technologies, newer business models, and ever-changing market demands. Business, market, and consumer demands are pushing such IT advancements as cloud, mobility, and IoT.

How Using Annotations with OpenTelemetry Can Lower Your MTTR

When it comes to gaining control over complex distributed systems, there are many indicators of performance that we must understand. One of the secrets to understanding complicated systems is the use of additional cardinality within our metrics, which provides further information about our distributed systems’ overall health and performance. Developers rely on the telemetry captured from these distributed workloads to determine what really went wrong and place it in context.

The Importance of Application Performance Monitoring.

In this digital era, applications are used on a daily basis to make our life easier. A lot of software applications are launched every day, continuously increasing competition in the market. There are thousands of applications available for a task. But, the success of any application highly depends on its performance. A good-performing application provides a flawless user experience to the customers. Ultimately, making performance a crucial metric for benefitting the company owning the software product.

Digitalization Challenge the future with Pandora FMS

Pandora FMS unifies information on all systems, from all departments and environments in a single console, coordinating efforts and presenting useful information to the appropriate person, at the right time. Your IT infrastructure shouldn't feel out of your control when it relies on external provider services. We don't just provide a product, we integrate a solution and engage with our customers from start to finish by executing successful projects.

Dashboard Fridays: Sample UptimeRobot Dashboard

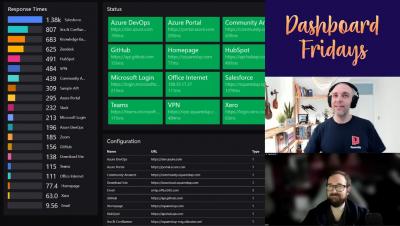
Join Adam Kinniburgh and Ashley Thompson as they showcase this example UptimeRobot Dashboard. Built in SquaredUp with the powerful WebAPI tile, this dashboard gives an overview of monitoring configured using UptimeRobot’s website monitoring features. Query UptimeRobot for information about your web tests, summarize them, and create a slick UptimeRobot dashboard in SquaredUp. This is an example of querying the web test data, though the other data sets are equally easy to pull in!