Operations | Monitoring | ITSM | DevOps | Cloud

DevOps

The latest News and Information on DevOps, CI/CD, Automation and related technologies.

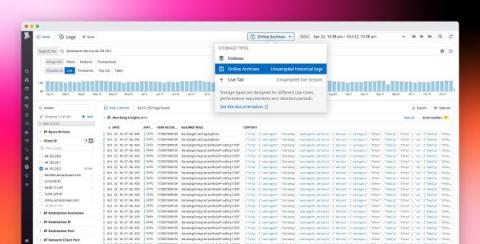
Historical log analysis and investigation with Online Archives

To have full visibility into modern cloud environments, businesses need to collect an ever-growing avalanche of log data from a range of highly complex data sources. Indexing logs is key for real-time monitoring and troubleshooting, but it can quickly become expensive at high volumes, meaning that organizations often must choose which logs to index and which to archive.

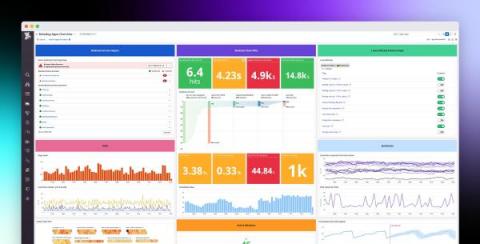
Extend your Datadog functionality with Datadog Apps

Last year, we launched the Datadog Marketplace, which lets Datadog partners develop and trade applications that provide custom monitoring solutions for specific use cases. Now, we’re pleased to announce Datadog Apps, which introduces even further customizability to the Datadog platform. With Datadog Apps, you can now build and share your own Datadog UI features that seamlessly combine functionality from your third-party tools with the full range of Datadog’s monitoring capabilities.

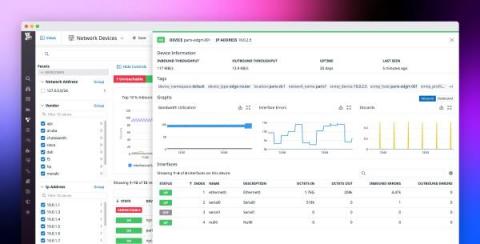
Introducing Network Device Monitoring

For many organizations, the success of their business depends on their ability to maintain on-prem or hybrid infrastructure. For instance, some companies rely on data centers for security reasons or to support their large, static workloads, while others must execute their critical business processes as close to the edge as possible to ensure minimal latency.

Dash 2021: Guide to Datadog's newest announcements

Today at Dash 2021, we announced new products and features that give your team even greater visibility into the health and performance of your code, databases, CI/CD pipelines, and more. Now, you can monitor network devices, get visibility into your services' golden signal metrics without touching a single line of code, and integrate third-party tools into our platform with Datadog Apps. We expanded RUM to include iOS error tracking, Session Replay, and Watchdog Insights.

Wind River Supports Intel Industrial SoCs Designed for Real-Time and AI-Driven Intelligent Systems

Wind River announces support for Intel Atom x6000 Series and Intel Pentium and Celeron N and J Series processors and 11th Gen Intel Core processors and Intel Celeron processors. This development is part of a multi-year effort to optimize Wind River software for Intel industrial system-on-a-chip offerings (SoCs).

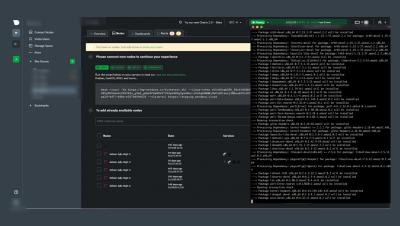
Install Netdata to get started monitoring Linux in minutes

Install Netdata to monitor your Linux servers using our one-line installer. Install on physical, virtual, container, and IoT nodes. Netdata’s free, open-source monitoring agent works with Netdata Cloud to help you monitor and troubleshoot every layer of your systems to find weaknesses before they turn into outages.

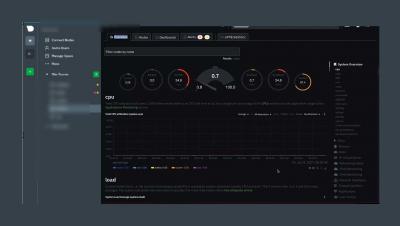
How to monitor Docker containers using Netdata health and performance

Learn how to connect and claim a Docker node to start monitoring with Netdata in minutes. See information like system CPU, available memory, disk usage, total network bandwidth, and much more. Netdata’s free, open-source monitoring agent works with Netdata Cloud to help you monitor and troubleshoot every layer of your systems to find weaknesses before they turn into outages.

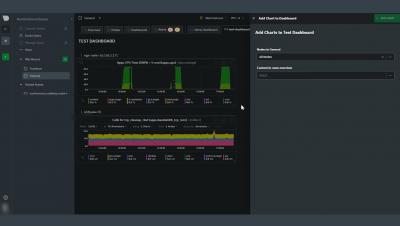
Learn how to build interactive dashboards with Netdata Cloud for troubleshooting systems

This video will show you how to build new dashboards with key metrics from any number of distributed systems in one place for a bird's eye view of your infrastructure. Create more meaningful visualizations for troubleshooting or keep a watchful eye on your infrastructure's most meaningful metrics without moving from node to node. Netdata’s free, open-source monitoring agent works with Netdata Cloud to help you monitor and troubleshoot every layer of your systems to find weaknesses before they turn into outages.