Dashboards

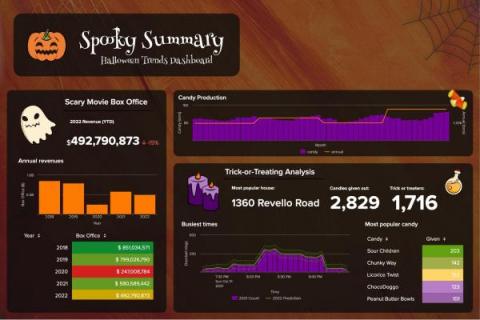
How We Built It: Getting Spooky with Splunk Dashboards

Dashboards are not just tools for businesses and other organizations to monitor and respond to their data, but can be a method of storytelling. All of our data has the potential to be crafted into compelling narratives, which can easily be accomplished with the help of Dashboard Studio’s customizable formats and advanced visualization tools. We can take a series of disparate datasets and bring them together in one place if they share a common theme — in this case, Halloween.

How to manage high cardinality metrics in Prometheus and Kubernetes

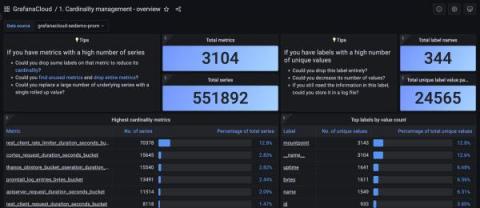
Over the last few months, a common and recurring theme in our conversations with users has been about managing observability costs, which is increasing at a rate faster than the footprint of the applications and infrastructure being monitored. As enterprises lean into cloud native architectures and the popularity of Prometheus continues to grow, it is not surprising that metrics cardinality (a cartesian combination of metrics and labels) also grows.

How to autoscale Grafana Loki queries using KEDA

Grafana Loki is Grafana Labs’ open source log aggregation system inspired by Prometheus. Loki is horizontally scalable, highly available, and multi-tenant. In addition, Grafana Cloud Logs is our fully managed, lightweight, and cost-effective log aggregation system based on Grafana Loki, with free and paid options for individuals, teams, and large enterprises.

Get better insights from industrial IoT data with Grafana

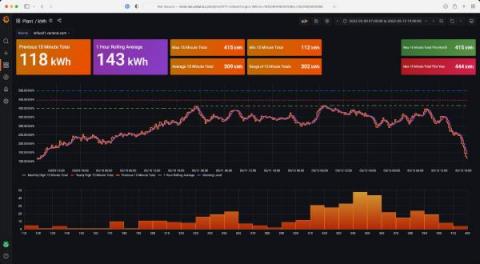
Varland Plating has been in the electroplating business since 1946. At their industrial job shop in Cincinnati, Ohio, they perform complex electrochemical treatments on steel, brass, and copper manufactured parts to create everything from corrosion-resistant building materials to decorative metals.

Grafana 9.2 release: Troubleshooting Grafana panels with a new support feature

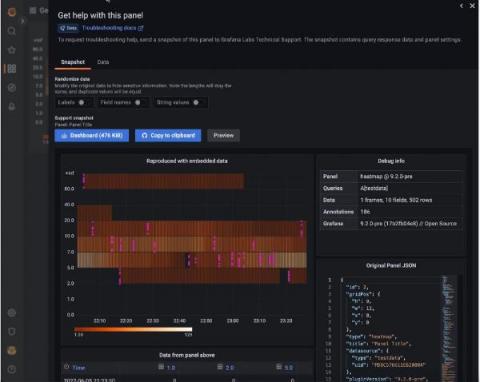
Ever run into issues building a panel in your Grafana dashboards? To help with those issues, the current support process for Grafana, Grafana Cloud, and Grafana Enterprise often requires many cycles where we request more information. This can be slow, frustrating for both our users and our support teams, and the process makes it difficult to reproduce issues without access to similar data.

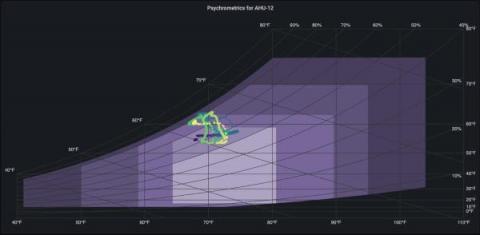
Monitoring HPC system health with Grafana and Psychart

Nicolas Ventura is a critical facilities engineer at NERSC, with experience in both mechanical and computer systems. The National Energy Research Scientific Computing Center (NERSC) is a modern data center that’s home to two powerful high-performance computing (HPC) systems used for worldwide scientific research in genetics, physics, geology, and more. As such, the infrastructure team at NERSC has to closely track the facility conditions to ensure optimal operations.

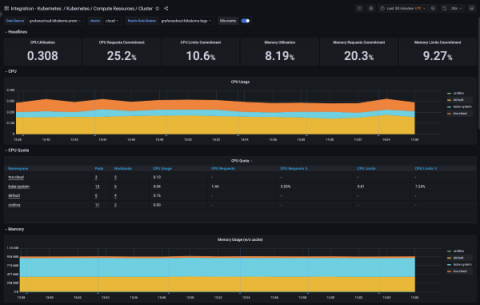
5 key benefits of Kubernetes monitoring

Kubernetes made it much easier to deploy and scale containerized applications, but it also introduced new challenges for IT teams trying to keep tabs on these newly distributed systems. Ops teams need proper visibility into their Kubernetes clusters so they can track performance metrics, audit changes to deployed environments, and retrieve logs that help debug application crashes.

How to Simplify Your Graphite Metric Ingestion Pipeline with Histograms

Many organizations relying on Graphite will be leveraging telemetry provided through Statsd. And if you rely on Graphite in combination with StatsD telemetry, you’re likely suffering from aggregation bloat. In a typical Graphite ingestion pipeline, applications emit data points via UDP, which are then received by an aggregator such as StatsD. Most StatsD servers only offer static aggregations, which must be configured upfront.