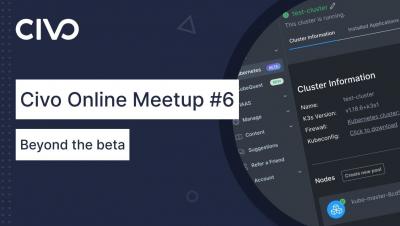
The latest News and Information on Containers, Kubernetes, Docker and related technologies.
The Prometheus Blackbox exporter allows endpoints exploration over several protocols, such as HTTP(S), DNS, TCP, and ICMP. This exporter generates multiple metrics on your configured targets, like general endpoint status, response time, redirect information, or certificate expiration dates. The Blackbox Exporter works out-of-the-box, as it just focuses on external visibility details. To get more detailed metrics, you can instrument your applications.
When we were moving an app to Kubernetes, we encountered a peculiar situation where other services running on Kubernetes started throwing a ThreadError from time to time, saying that a resource is unavailable. We started investigating, and it turned out that you want to know where your AppSignal error has occurred. A short reminder - Kubernetes works on two levels: So, you want to know which pod and which node ran a particular AppSignal transaction.