Operations | Monitoring | ITSM | DevOps | Cloud

APM

The latest News and Information on Application Performance Monitoring and related technologies.

Client logging | Best practices and examples

Client logging refers to the practice of collecting and storing log messages generated by client software, such as a web browser or mobile application. These log messages can provide valuable information about the behavior and performance of the client software, as well as any errors or issues that may have occurred. Client logging is often used by developers to troubleshoot and debug software issues, as well as to gather data for analysis and performance optimization.

How JMX Monitoring Works for Java Applications

The Java Management Extensions (JMX) framework is a Java technology that includes tools for managing and monitoring applications, system objects, and service-oriented networks. The JMX framework is designed to simplify the management of local and remote Java applications. The JMX framework introduces the concept of MBeans for real-time management of applications, whereby resources are represented by objects called MBeans (Managed Beans).

Morgan Logger | Tutorial on how to use in an Express application

Morgan is a popular HTTP logging library for Node.js. It is designed to be a simple and flexible tool for logging HTTP requests and responses in Node.js applications. Using Morgan, you can easily log requests made to your Node.js server, including information such as the request method, the URL of the request, the status code of the response, and the length of the response body. You can also customize the format of the log messages and specify which requests should be logged and which should be ignored.

JSON Logs | Best Practices, benefits, and examples

JSON (JavaScript Object Notation) is a lightweight data-interchange format that has gained widespread popularity in recent years due to its simplicity and flexibility. It is easy for humans to read and write and for machines to parse and generate, making it a great choice for transmitting data in web applications. Logs serve multiple purposes for application developers. They are essential to understand what's happening in your application.

Datadog on Building an Event Storage System

When Datadog introduced its Log Management product, it required a new event data storage platform, as storing logs and events is a completely different problem from storing metrics, which was the first Datadog product. Over time, Datadog introduced more and more products that needed to store and index multi-kilobyte timeseries “events”, re-using the Event Platform infrastructure from Log Management. The increased use of the Event Platform and the new feature requirements coming from new products started exposing the limitations of the legacy system and the need for a new approach

SigNoz - Logs Performance Benchmark

Logs are an integral part of any system that helps you get information about the application state and how it handles its operations. The goal of this blog is to compare the commonly used logging solutions, i.e., ElasticSearch(ELK stack) and Loki(PLG stack), with SigNoz on three parameters: ingestion, query, and storage. Performance benchmarks are not easy to execute. Each tool has nuances, and the testing environments must aim to provide a level playing field for all tools.

Scout APM: Your All-in-One APM Tool

Technology is everywhere in today's world; every company has its application or website to run its business. Everyone company wants to make sure that their application runs well in all the cases and handles edge cases, but manually it is not that easy. Application performance monitoring tool helps in automating the monitoring process. These APM tools help monitor the application 24x7 and can send alerts regularly if anything fails or crashes in the application.

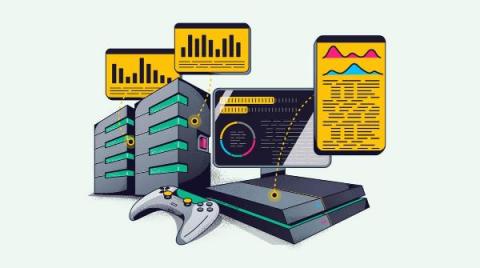
Application Performance Monitoring in the Gaming Industry

The gaming industry delivers specialized software at scale to users who expect a flawless interface. Application performance monitoring (APM) will measure critical software performance parameters using telemetry data. By monitoring this data, teams can ensure their game delivers the best user experience and quickly detect when the software needs updates to fix errors or meet key performance indicators (KPIs).

Dashboard Fridays: Sample AppDynamics Dashboard

Together, these three AppDynamics dashboards provide a high-level overview of the health and performance of a service – reporting on application-level metrics, infrastructure, and more importantly, end-user experience. Tune in to learn how it was made, the challenges it solves, and our top tips for building it yourself.

What is a log shipper - Top 7 Log Shippers that you can use

Centralizing logs (arranging all records in one place) is often challenging as we need to decide whether to use a log shipper or directly log from the application. If you are not familiar with a log shipper, logging directly from the library might be a suitable option for development (it is easy to configure). However, in production, you'll likely want to use one of the available log shippers, mainly due to buffers, since blocking the application or dropping data (immediately) may not be an option.