Operations | Monitoring | ITSM | DevOps | Cloud
APM
The latest News and Information on Application Performance Monitoring and related technologies.
Update: Expanding our new API functionality
Docker Container Lifecycle Tutorial | Create, Run, Pause, Stop, Kill
PHP Symfony APM Benefits
If you are a Symfony PHP developer, you will need Symfony monitoring. With the ever-increasing need for web applications to perform at their best, developers require full visibility and observability. This way, they have full control of the performance and its maintenance. Imagine you have created an application. You have deployed it but do not know how it works. This is where an Application Performance Monitoring tool is of great use. It should be on every developer’s toolkit.
Configuration and Change Tracking: A Key Part of Observability Strategy
Configuration Management and Change Tracking are well known key tenets of project management. Change tracking and controlled change ensure that there is a record of the state of a system and if issues arise the cause can be linked to effects. In this blog, I will use a real-world example to demonstrate the importance of configuration and change tracking when it comes to IT observability.
Watchdog: AI Across the Datadog Platform
What is Internet Performance Monitoring and How is it Different from APM?
Most Internet-centric organizations today use some form of APM tools, as they should. But they are insufficient. Over the last ten years, the world has completely changed. If you think about it, in the first decade of this millennium, most businesses had an Exchange server, maybe Siebel CRM, a file share, and a range of other business apps, usually hosted in the same building. Everything was on the LAN. Today, it is the exact opposite. Everything is distributed.
The Benefits of APM in a Staging Environment
The earlier you can integrate APM metrics into your application, especially in your staging environment, the better. Why? Using APM metrics can help with visibility in your application development process, as the sooner you can see how your latest code performs, the faster you can optimize your application.
Container Monitoring Demo
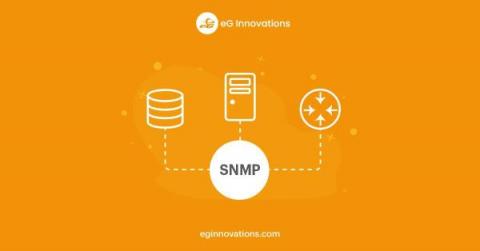
Making SNMP Monitoring Scalable, Reliable and Extensible with eG Enterprise
SNMP stands for Simple Network Management Protocol. It is an Internet Standard protocol for collecting and organizing information about managed devices on IP networks and for modifying that information to change device behavior. Figure 1: How SNMP works SNMP exposes management data in the form of variables on the managed systems organized in a management information base (MIB), which describe the system status and configuration.


