Operations | Monitoring | ITSM | DevOps | Cloud
Organisations Need to be Data Innovators to Make a Real Difference
Data is the lifeblood of any organisation. It’s what drives customer engagement, boosts employee productivity, streamlines operations and, in some cases, even transforms age-old companies into digital powerhouses.
InfluxDB Community Office Hours - May 2020
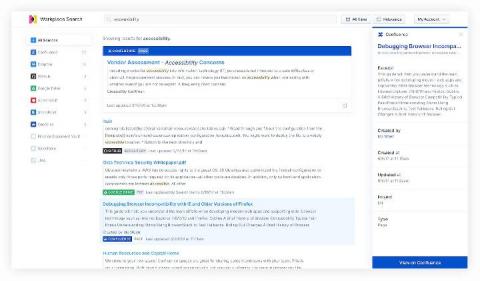
Searching Salesforce: Boosting your teams' productivity with Elastic Workplace Search
“If it’s not in Salesforce, it didn’t happen.” You’ve undoubtedly heard it, or perhaps you’ve said it yourself. And why not? Over the past 15 years, Salesforce has redefined the CRM industry, becoming the de facto solution for managing sales, customer service, marketing automation, and analytics functions with its cloud-only approach. As Salesforce’s solutions have expanded so has their user base.
Announcing Graylog v3.3
Today we are officially releasing Graylog v3.3 This release includes enhancements to search, events, and alerts that introduce greater efficiencies to your daily log management efforts and strengthen your audit and compliance capabilities. Please read on for detailed descriptions of each feature.
The Next 12 Months - Where IT Leaders Anticipate Spending More Time On
IDG’s recent “State of the CIO” survey across IT leaders has revealed the impact of COVID-19 on IT organizations and the sudden and unforeseen shifts of their initial 2020 plans.
Painting with Data: Choropleth SVG
With the release of the Splunk Enterprise Dashboards Beta version 0.5.2 comes an exciting new feature that I’m sure many people will find useful: Choropleth SVG Objects. What are Choropleth SVG Objects? Put simply, it’s painting with data. To help you navigate getting started with the current iteration of this feature, I’m writing a blog to show you just how easy it is to use and create absolutely custom SVG objects.
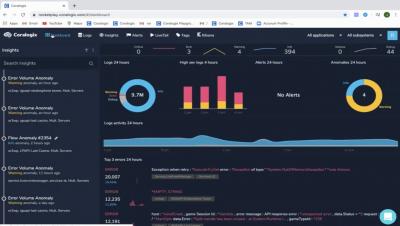
Coralogix Quick Demo April 2020
Elasticsearch Service on Google Cloud Marketplace: New ways to purchase and discover
Last year we announced an expanded partnership with Google to bring Elasticsearch Service to even more Google Cloud users. We were also named one of Google Cloud's partners of the year! We've since deepened our partnership, and today we are proud to announce new ways to purchase and discover Elasticsearch Service in the Google Cloud Marketplace. You can now purchase monthly Gold and Platinum subscriptions as well as Standard, Gold, and Platinum annual subscriptions through the marketplace.
What's New in the Splunk Machine Learning Toolkit 5.2?
We're excited to announce that the Splunk Machine Learning Toolkit (MLTK) version 5.2 is available for download today on Splunkbase! Earlier this month, I discussed how the release of version 5.2 will make machine learning more accessible to more users. Splunk’s MLTK lets our customers apply machine learning to the data they're already capturing in Splunk, develop models, and operationalize these algorithms to glean new insights and make more informed decisions.


