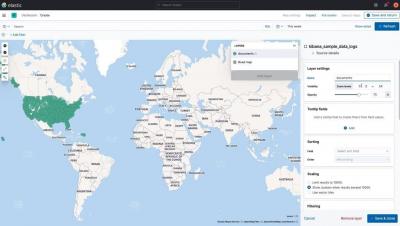
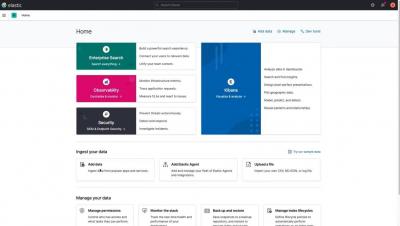
Operations | Monitoring | ITSM | DevOps | Cloud

Analytics

Making data-driven decisions with log management software

Today, most enterprises rightfully think about their business strategies by leveraging available data. Data-driven decisions certainly are more solid and reliable than those based upon mere instinct, intuition or just plain mysticism. Logs, in particular, are a fantastic source of information from which a company can draw to fuel its business intelligence (BI) strategies. However, there’s a big and sometimes unbridgeable gap between theory and practice.

How Logz Helps Snyk with Open Source Security

Snyk is a developer-centric company whose raison d’être is to identify and patch vulnerabilities in open source security software. With about 50 engineers, Snyk VP Engineering Anton Drukh wants to maintain flexibility in how the team operates. The best way to ensure that is to give them as much insight into their own work as possible, and hence options. They also look at the state of open source security across the industry.

Migrating from Splunk to the Elastic Stack: Data migration

When Splunk was first released almost 20 years ago, it helped many organizations realize the power of logs to gain business insights with pricing based on the volume of data ingested per day. Over the last two decades, the volume, variety, and velocity of data generated by systems and users have grown exponentially. The demands of business and operations have quickly moved beyond compliance and basic reporting.

Monitor ClickHouse with Datadog

ClickHouse is an open source database management system, and was originally developed as a backend for Yandex’s Metrica analytics platform. ClickHouse is column oriented, meaning that it can quickly scan through ranges of values in a single column without touching irrelevant values in other columns. This makes ClickHouse well suited for online analytical processing (OLAP).

Streaming Time Series with Jupyter and InfluxDB

Jupyter Notebooks are wonderful because they provide a way to share code, explanations, and visualizations in the same place. Notebooks add narrative to computation. The cells compartmentalize steps and reduce the fear or hesitation associated with editing code. In this way, notebooks act as an invitation for experimentation. Today, I want to extend that invitation and apply it to InfluxDB. In this post, we’ll learn how to query our system stats data from InfluxDB v2.0 using Flux.

Cyclical Statistical Forecasts and Anomalies - Part III

Remember when you wanted great alerts, so you read our past two blogs about cyclical statistical forecasts and anomalies? Hopefully, the techniques in those blogs gave you some great results. Here we’re going to show you another way of finding anomalies in your data using a slightly different technique.

Quantitative Finance with Splunk: 'Who Correlated My Asset'

Over the past 24 months or so, I have been studying investing/trading while also working to become more proficient with Splunk. I like to combine activities and gain momentum, so I decided stock market and economic data would be the perfect way to dig deeper into Splunk and hopefully improve my investing/trading. In the beginning, I only looked at it as a way to learn more about Splunk while using data that was interesting to me.